
Assessment is (often) neither good nor true.
Posted: January 9, 2016 Filed under: Education, Opinion | Tags: advocacy, aesthetics, beauty, community, design, education, ethics, higher education, in the student's head, kohn, principles of design, rapaport, reflection, student perspective, teaching, teaching approaches, thinking, tools, universal principles of design, work/life balance, workload 3 CommentsIf you’ve been reading my blog over the past years, you’ll know that I have a lot of time for thinking about assessment systems that encourage and develop students, with an emphasis on intrinsic motivation. I’m strongly influenced by the work of Alfie Kohn, unsurprisingly given I’ve already shown my hand on Focault! But there are many other writers who are… reassessing assessment: why we do it, why we think we are doing it, how we do it, what actually happens and what we achieve.

In my framing, I want assessment to be as all other aspects of education: aesthetically satisfying, leading to good outcomes and being clear and what it is and what it is not. Beautiful. Good. True. There are some better and worse assessment approaches out there and there are many papers discussing this. One of these that I have found really useful is Rapaport’s paper on a simplified assessment process for consistent, fair and efficient grading. Although I disagree with some aspects, I consider it to be both good, as it is designed to clearly address a certain problem to achieve good outcomes, and it is true, because it is very honest about providing guidance to the student as to how well they have met the challenge. It is also highly illustrative and honest in representing the struggle of the author in dealing with the collision of novel and traditional assessment systems. However, further discussion of Rapaport is for the near future. Let me start by demonstrating how broken things often are in assessment, by taking you through a hypothetical situation.
Thought Experiment 1
Two students, A and B, are taking the same course. There are a number of assignments in the course and two exams. A and B, by sheer luck, end up doing no overlapping work. They complete different assignments to each other, half each and achieve the same (cumulative bare pass overall) marks. They then manage to score bare pass marks in both exams, but one answers only the even questions and only answers the odd. (And, yes, there are an even number of questions.) Because of the way the assessment was constructed, they have managed to avoid any common answers in the same area of course knowledge. Yet, both end up scoring 50%, a passing grade in the Australian system.
Which of these students has the correct half of the knowledge?
I had planned to build up to Rapaport but, if you’re reading the blog comments, he’s already been mentioned so I’ll summarise his 2011 paper before I get to my main point. In 2011, William J. Rapaport, SUNY Buffalo, published a paper entitled “A Triage Theory of Grading: The Good, The Bad and the Middling.” in Teaching Philosophy. This paper summarised a number of thoughtful and important authors, among them Perry, Wolff, and Kohn. Rapaport starts by asking why we grade, moving through Wolff’s taxonomic classification of assessment into criticism, evaluation, and ranking. Students are trained, by our world and our education systems to treat grades as a measure of progress and, in many ways, a proxy for knowledge. But this brings us into conflict with Perry’s developmental stages, where students start with a deep need for authority and the safety of a single right answer. It is only when students are capable of understanding that there are, in many cases, multiple right answers that we can expect them to understand that grades can have multiple meanings. As Rapaport notes, grades are inherently dual: a representative symbol attached to a quality measure and then, in his words, “ethical and aesthetic values are attached” (emphasis mine.) In other words, a B is a measure of progress (not quite there) that also has a value of being … second-tier if an A is our measure of excellence. A is not A, as it must be contextualised. Sorry, Ayn.
When we start to examine why we are grading, Kohn tells us that the carrot and stick is never as effective as the motivation that someone has intrinsically. So we look to Wolff: are we critiquing for feedback, are we evaluating learning, or are we providing handy value measures for sorting our product for some consumer or market? Returning to my thought experiment above, we cannot provide feedback on assignments that students don’t do, our evaluation of learning says that both students are acceptable for complementary knowledge, and our students cannot be discerned from their graded rank, despite the fact that they have nothing in common!
Yes, it’s an artificial example but, without attention to the design of our courses and in particular the design of our assessment, it is entirely possible to achieve this result to some degree. This is where I wish to refer to Rapaport as an example of thoughtful design, with a clear assessment goal in mind. To step away from measures that provide an (effectively) arbitrary distinction, Rapaport proposes a tiered system for grading that simplifies the overall system with an emphasis on identifying whether a piece of assessment work is demonstrating clear knowledge, a partial solution, an incorrect solution or no work at all.
This, for me, is an example of assessment that is pretty close to true. The difference between a 74 and a 75 is, in most cases, not very defensible (after Haladyna) unless you are applying some kind of ‘quality gate’ that really reduces a percentile scale to, at most, 13 different outcomes. Rapaport’s argument is that we can reduce this further and this will reduce grade clawing, identify clear levels of achieve and reduce marking load on the assessor. That last point is important. A system that buries the marker under load is not sustainable. It cannot be beautiful.
There are issues in taking this approach and turning it back into the grades that our institutions generally require. Rapaport is very open about the difficulties that he has turning his triage system into an acceptable letter grade and it’s worth reading the paper to see that discussion alone, because it quite clearly shows what
Rapaport’s scheme clearly defines which of Wolff’s criteria he wishes his assessment to achieve. The scheme, for individual assessments, is no good for ranking (although we can fashion a ranking from it) but it is good to identify weak areas of knowledge (as transmitted or received) for evaluation of progress and also for providing elementary critique. It says what it is and it pretty much does it. It sets out to achieve a clear goal.
The paper ends with a summary of the key points of Haladyna’s 1999 book “A Complete Guide to Student Grading”, which brings all of this together.
Haladyna says that “Before we assign a grade to any students, we need:
- an idea about what a grade means,
- an understanding of the purposes of grading,
- a set of personal beliefs and proven principles that we will use in teaching
and grading,
- a set of criteria on which the grade is based, and, finally,
- a grading method,which is a set of procedures that we consistently follow
in arriving at each student’s grade. (Haladyna 1999: ix)
There is no doubt that Rapaport’s scheme meets all of these criteria and, yet, for me, we have not yet gone far enough in search of the most beautiful, most good and most true extent that we can take this idea. Is point 3, which could be summarised as aesthetics not enough for me? Apparently not.
Tomorrow I will return to Rapaport to discuss those aspects I disagree with and, later on, discuss both an even more trimmed-down model and some more controversial aspects.
Learning Analytics: Far away, so close.
Posted: November 5, 2015 Filed under: Education, Opinion | Tags: blogging, community, data, data analytics, education, educational problem, educational research, focus, higher education, learning, learning analytics, measurement, resources, support, teaching, teaching approaches, thinking, universal principles of design 2 CommentsI’ve been thinking about learning analytics and, while some Unis have managed to solve parts of the problem, I think that we need to confront the complexity of the problem, to explain why it’s so challenging. I break it into five key problems.
- Data. We don’t currently collect enough of it to analyse, what we do collect is of questionable value and isn’t clearly tied to mechanisms, and we have not confronted the spectre of what we do with this data when we get it.
- Mechanisms linking learning and what is produced. The mechanisms are complex. Students could be failing for any number of reasons, not the least of which is crap staff. Trying to work out what has happened by looking at outputs is unlikely to help.
- Focus. Generally, we measure things to evaluate people. This means that students do tests to get marked and, even where we mix this up with formative work, they tend to focus on the things that get them marks. That’s because it’s how we’ve trained them. This focus warps measurement into an enforcement and judgment mechanism, rather than a supportive and constructive mechanism.
- Community. We often mandate or apply analytics as an extension of the evaluation focus above. This means that we don’t have a community who are supported by analytics, we have a community of evaluators and the evaluated. This is what we would usually label as a Panopticon, because of the asymmetrical application of this kind of visibility. And it’s not a great environment for education. Without a strong community, why should staff go to the extra effort to produce the things required to generate more data if they can’t see a need for it? This is a terribly destructive loop as it requires learning analytics to work and be seen as effective before you have the data to make learning analytics work!
- Support. When we actually have the data, understand the mechanism, have the right focus and are linked in to the community, we still need the money, time and other resources to provide remediation, to encourage development, to pay for the technology, to send people to places where they can learn. For students and staff. We just don’t have that.
I think almost all Unis are suffering from the same problems. This is a terribly complex problem and it cannot be solved by technology alone.
It’s certainly not as easy as driving car. You know that you make the car go faster by pushing on one pedal and you make it go slower by pushing on another. You look at your speedometer. This measures how often your wheels are rotating and, by simple arithmetic, gives you your speed across the road. Now you can work out the speed you want to travel at, taking into account signs, conditions and things like that. Simple. But this simple, everyday, action and its outcomes are the result of many, many technological, social and personal systems interacting.
The speedometer in the car is giving you continuously available, and reasonably reliable, data on your performance. You know how to influence that performance through the use of simple and direct controls (mechanism). There exists a culture of driver training, road signage and engineering, and car design that provides you with information that ties your personal performance to external achievement (These are all part of support, focus and community). Finally, there are extrinsic mechanisms that function as checks and balances but, importantly, they are not directly tied to what you are doing in the car, although there are strong causative connections to certain outcomes (And we can see elements of support and community in this as we all want to drive on safe roads, hence state support for this is essential).
We are nowhere near the car scenario with learning analytics right now. We have some measurements of learning in the classroom because we grade assignments and mark exams. But these are not continuous feedback, to be consulted wherever possible, and the mechanisms to cause positive change in these are not necessarily clear and direct. I would argue that most of what we currently do is much closer to police enforcement of speed. We ask students to drive a track and, periodically, we check to see if they’re doing the correct speed. We then, often irrevocably from a grading sense, assign a mark to how well they are driving the track and settle back to measure them again later.
Learning analytics faces huge problems before it reaches this stage. We need vast quantities of data that we are not currently generating. Many University courses lack opportunities to demonstrate prowess early on. Many courses offer only two or three measurements of performance to determine the final grade. This trying to guess our speed when the speedo only lights up every three to four weeks after we have pressed a combination of pedals.
The mechanisms for improvement and performance control in University education are not just murky, they’re opaque. If we identify a problem, what happens? In the case of detecting that we are speeding, most of us will slow down. If the police detect you are speeding, they may stop you or (more likely) issue you a fine and eventually you’ll use up your licence and have to stop driving. We just give people low marks or fail them. But, combine this with mechanism issues, and suddenly we need to ask if we’re even ready to try to take action if we had the analytics.
Let’s say we get all the data and it’s reliable and pedagogically sensible. We work out how to link things together. We build community support and we focus it correctly. You run analytics over your data. After some digging, you discover that 70% of your teaching staff simply don’t know how to do their jobs. And, as far as you can see, have been performing at this standard for 20 years.
What do you do?
Until we are ready to listen to what analytics tell us, until we have had the discussion of how we deal with students (and staff) who may wish to opt out, and until we have looked at this as the monstrous, resource-hungry, incredibly complex problem that it is, we really have to ask if we’re ready to take learning analytics seriously. And, given how much money can be spent on this, it’s probably better to work out if we’re going to listen before we invest money into a solution that won’t work because it cannot work.
Promoting acceptance by understanding people.
Posted: June 28, 2015 Filed under: Education, Opinion | Tags: academic publishing, advocacy, authenticity, blogging, education, feedback, fiction, Matthew Effect, publishing, scientific publishing, thinking, universal principles of design, workload, writing 4 CommentsLet me start by putting up a picture of some people celebrating!

Wow, that’s a really happy group of people!
My first confession is that the ‘acceptance’ I’m talking about is for academic and traditional fiction publishing. The second confession is that I have attempted to manipulate you into clicking through by using a carefully chosen title and presented image. This is to lead off with the point I wish to make today: we are a mess of implicit and explicit cognitive biases and to assume that we have anything approximating a fair evaluation mechanism to get work published is to, sadly, be making a far reaching assumption.
If you’ve read this far, my simple takeaway is “If people don’t even start reading your work with a positive frame of mind and a full stomach, your chances of being accepted are dire.”
If you want to hang around my argument is going to be simple. I’m going to demonstrate that, for much simpler assessments than research papers or stories, simple cognitive biases have a strong effect. I’m going to follow this and indicate how something as simple as how hungry you are can affect your decision making. I’m then going to identify a difference between scientific publishing and non-scientific publishing in terms of feedback and why expecting that we will continue to get good results from both approaches is probably too optimistic. I am going to make some proposals as to how we might start thinking about a fix, but only to start discussion because my expertise in non-academic publishing is not all that deep and limited by not being an editor or publisher!
[Full disclosure: I am happily published in academia but I am yet to be accepted for publication in non-academic approaches. I am perfectly comfortable with this so please don’t read sour grapes into this argument. As you’ll see, with the approaches I propose, I would in fact strip myself of some potential bias privileges!]
I’ve posted before on an experiment [1] where the only change to the qualifications of a prospective lab manager was to take the name from male to female. The ‘female’ version of this CV got offered less money, less development support and was ‘obviously’ less qualified. And this effect occurred whether the assessor was a man or a woman. This is the pretty much the gold standard for experiments of this type because it reduced any possibility of someone acting out of character because they knew what the experiment was trying to prove. There’s a lot of discussion in fiction at the moment about gendered bias, as well as academia. You’re probably aware of the Bechdel Test, which simply asks if there are two named women in a film who talk to each other about something other than men, and how often the mainstream media fails that test. But let’s look at something else. Antony LaPaglia tells a story that he used to get pulled up on his American accent whenever anyone knew that he was Australian. So he started passing as American. Overnight, complaints about his accent went away.
Compared to assessing a manuscript, reading a CV, bothering to put in two woman with names and a story, and spotting an accent are trivial and yet we can’t get these right without bias.
There’s another thing called the Matthew Effect, which basically says that the more you have, the more you’re going to get (terrible paraphrasing). Thus, the first paper in a field will be one of the most cited, people are comfortable giving opportunities to people who have used them well before, and so on. It even shows up in graph theory, where the first group of things connected together tend to become the most connected!
So, we have lots of examples of bias that comes in, if we know enough about someone that the bias can engage. And, for most people who aren’t trying to be discriminatory, it’s actually completely unconscious. Really? You don’t think you’d notice?
Let’s look at the hunger argument. An incredible study [2] (Economist link for summary) shows that Israeli judges are less likely to grant parole, the longer they’ve waited since they ate, even when taking other factors into account. Here’s a graph. Those big dips are meal breaks.

Perhaps don’t schedule your hearing for just before lunch…
When confronted with that terrifying graph, the judges were totally unaware of it. The people in the court every day hadn’t noticed it. The authors of the study looked at a large number of factors and found some things that you’d expect in terms of sentencing but the meal break plunges surprised everyone because they had never thought to look for it. The good news is that, most days, the most deserving will still get paroled but, and it’s a big but, you still have to wonder about the people who should have been given parole who were denied because of timing and also the people who were paroled who maybe should not have been.
So what distinguishes academia and non-academic publishing? Shall we start by saying that, notionally, many parts of academic publishing subscribe to the Popperian model of development where we expose ideas to our colleagues and they tear at them like deranged wolves until we fashion truth? As part of that, we expect to get reviews from almost all submissions, whether accepted or not, because that is how we build up academic consensus and find out new things. Actual publication allows you to put your work out to everyone else where they can read it, work with it or use it to fashion a counter-claim.
In non-academic publishing, the publisher wants something that is saleable in the target market and the author wants to provide this. The author probably also wants to make some very important statements about truth, beauty, the lizard people or anything else (much as in academic publishing, the spread of ideas is crucial). However, from a publisher’s perspective, they are not after peer-verified work of sufficient truth, they are after something that matches their needs in order to publish it, most likely for profit.
Both are directly or indirectly prestige markers and often have some form of financial rewards, as well as some truth/knowledge construction function. Non-academic authors publish to eat, academic authors publish to keep their jobs or get tenure (often enough to allow you to eat). But the key difference is the way that feedback is given because an academic journal that gave no feedback would have trouble staying in business (unless it had incredible acceptance already, see Matthew Effect) because we’re all notionally building knowledge. But “no feedback” is the default in other publishing.
When I get feedback academically, I can quickly work out several things:
- Is the reviewer actually qualified to review my work? If someone doesn’t have the right background, they start saying things like surely when they mean I don’t know, and it quickly tells you that this review will be uninformative.
- Has the reviewer actually read the work? I would ask all the academics reading this to send me $1 if they’ve ever been told to include something that is obviously in the paper and takes up 1-2 pages already, except I am scared of the tax and weight implications.
- How the feedback can be useful. Good feedback is great. It spots holes, it reinforces bridges, it suggests new directions.
- If I want to publish in that venue again. If someone can’t organise their reviewers and oversee the reviews properly? I’m not going to get what I need to do good work. I should go and publish elsewhere.
My current exposure to non-academic publishing has been: submit story, wait, get rejection. Feedback? “Not suitable for us but thank you for your interest”, “not quite right for us”,”I’m going to pass on this”. I should note that the editors have all been very nice, timely (scarily so, in some cases) and all of my interactions have been great – my problem is mechanistic, not personal. I should clearly state that I assume that point 1 from above holds for all non-academic publishing, that is that the editors have chosen someone to review in a genre that they don’t actually hate and know something about. So 1 is fine. But 2 is tricky when you get no feedback.
But that tricky #2, “Has the reviewer actually read the work”, in the context of my previous statements really becomes “HOW has the reviewer read my work?” Is there an informal ordering of people you think you’ll enjoy to newbies, even unconsciously? How hungry is the reviewer when they’re working? Do they clear up ‘simple checks’ just before lunch? In the absence of feedback, I can’t assess the validity of the mechanism. I can’t improve the work with no feedback (step 3) and I’m now torn as to whether this story was bad for a given venue or whether my writing is just so awful that I should never darken their door again! (I accept, dear reader, that this may just be the sad truth and they’re all too scared to tell me.)
Let me remind you that implicit bias is often completely unconscious and many people are deeply surprised when they discover what they have been doing. I imagine that there are a number of reviewers reading this who are quite insulted. I certainly don’t mean to offend but I will ask if you’ve sat down and collected data on your practice. If you have, I would really love to see it because I love data! But, if what you have is your memory of trying to be fair… Many people will be in denial because we all like to think we’re rational and fair decision makers. (Looks back at those studies. Umm.)
We can deal with some aspects of implicit bias by using blind review systems, where the reviewer only sees the work and we remove any clues as to who wrote it. In academia this can get hard because some people’s contributed signature is so easy to see but it is still widely used. (I imagine it’s equally hard for well known writers.) This will, at least, remove gender bias and potentially reduce the impact of “famous people”, unless they are really distinctive. I know that a blinding process isn’t happening in all of the parts of non-academic publishing because my name is all over my manuscripts. (I must note that there are places that use blind submission, such as Andromeda Spaceways Inflight Magazine and Aurealis, for initial reading, which is a great start.) Usually, when I submit, my covering letter has to clearly state my publication history. This is the very opposite of a blind process because I am being asked to rate myself for Matthew Effect scaling every time I submit!
(There are also some tips and tricks in fiction, where your rejections can be personalised, yet contain no improvement information. This is still “a better rejection” but you have to know this from elsewhere because it’s not obvious. Knowing better writers is generally the best way to get to know about this. Transparency is not high, here.)
The timing one is harder because it requires two things: multiple reviewers and a randomised reading schedule, neither of which take into account the shoe string budgets and volunteer workforce associated with much of fiction publishing. Ideally, an anonymised work gets read 2-3 times, at different times relative to meals and during the day, taking into account the schedule of the reader. Otherwise, that last manuscript you reject before rushing home at 10pm to reheat a stale bagel? It would have to be Hemingway to get accepted. And good Hemingway at that.
And I’d like to see randomised reading applied across academic publishing as well. And we keep reviewing it until we actually reach a consensus. I’ve been on a review panel recently where we had two ‘accepts’, two ‘mehs’ and two ‘kill it with fires’ for the same paper. After group discussion, we settled for ‘a weak accept/strong meh’. Why? Because the two people who had rated it right down weren’t really experts so didn’t recognise what was going on. Why were they reviewing? Because it’s part of the job. So don’t think I’m going after non-academic publishing here. I’m exposing problems in both because I want to try and fix both.
But I do recognise that the primary job of non-academic publishing is getting people to read the publication, which means targeting saleable works. Can we do this in a way that is more systematic than “I know good writing when I see it” because (a) that doesn’t scale and (b) the chances of that aligning across more than two people is tiny.
This is where technological support can be invaluable. Word counting, spell checking and primitive grammar checking are all the dominion of the machine, as is plagiarism detection on existing published works. So step one is a brick wall that says “This work has not been checked against our submissions standards: problems are…” and this need not involve a single human (unless you are trying to spellcheck The Shugenkraft of Berzxx, in which case have a tickbox for ‘Heavy use of neologisms and accents’.) Plagiarism detection is becoming more common in academic writing and it saves a lot of time because you don’t spend it reading lifted work. (I read something that was really familiar and realised someone had sent me some of my own work with their name on it. Just… no.)
What we want is to go from a flood, to a river, then to manage that river and direct it to people who can handle a stream at a time. Human beings should not be the cogs and failure points in the high volume non-academic publishing industry.
Stripping names, anonymising and randomly distributing work is fairly important if we want to remove time biases. Even the act of blinding and randomising is going to reduce the chances that the same people get the same good or bad slots. We are partially systematic. Almost everyone in the industry is overworked, doing vast and wonderful things and, in the face of that, tired and biassed behaviour becomes more likely.
The final thing that would be useful is something alone the lines of a floating set of check boxes that sit with the document, if it’s electronic. (On paper, have a separate sheet that you can scan in once it’s filled in and then automatically extract the info.) What do you actually expect? What is this work/story not giving you? Is it derivative work? Is it just all talk and no action? Is it too early and just doesn’t go anywhere? Separating documents from any form of feedback automation (or expecting people to type sentences) is going to slow things down and make it impossible to give feedback. Every publishing house has a list of things not to do, let’s start with the 10 worst of those and see how many more we can get onto the feedback screen.
I am thinking of an approach that makes feedback an associated act of reading and can then be sent, with accept or reject, in the same action. Perhaps it has already been created and is in use in fine publishing houses, but my work hasn’t hit a bar where I even get that feedback? I don’t know. I can see that distributed editorial boards, like Andromeda, are obviously taking steps down this path because they have had to get good at shunting stuff around at scale and I would love to know how far they’ve got. For me, a mag that said “We will always give you even a little bit of feedback” will probably get all of my stuff first. (Not that they want it but you get the idea.)
I understand completely that publishers are under no obligation whatsoever to do this. There is no right to feedback nor is there an expectation outside of academia. But if we want good work, then I think I’ve already shown that we are probably missing out on some of it and, by not providing feedback, some (if not many) of those stories will vanish, never worked on again, never seen again, because the authors have absolutely no guidance on how to change their work.
I have already discussed mocking up a system, building from digital humanist approaches and using our own expertise, with one of my colleagues and we hope to start working on something soon. But I’d rather build something that works for everyone and lets publishers get more good work, authors recognised when they get it right, and something that brings more and more new voices into the community. Let me know if it’s already been written or take me to school in the comments below. I can’t complain about lack of feedback and then ignore it when I get it!
[1] PNAS, vol. 109 no. 41, Corinne A. Moss-Racusin, 16474–16479, doi: 10.1073/pnas.1211286109
[2] PNAS vol. 108 no. 17, Shai Danziger, 6889–6892, doi: 10.1073/pnas.1018033108
EduTech AU 2015, Day 2, Higher Ed Leaders, “Assessment: The Silent Killer of Learning”, #edutechau @eric_mazur
Posted: June 3, 2015 Filed under: Education | Tags: assessment, educational problem, educational research, edutech2015, edutechau, eric mazur, feedback, harvard, higher education, in the student's head, learning, peer instruction, plagiarism, student perspective, students, teaching, teaching approaches, thinking, time banking, tools, universal principles of design, workload 3 CommentsNo surprise that I’m very excited about this talk as well. Eric is a world renowned educator and physicist, having developed Peer Instruction in 1990 for his classes at Harvard as a way to deal with students not developing a working physicist’s approach to the content of his course. I should note that Eric also gave this talk yesterday and the inimitable Steve Wheeler blogged that one, so you should read Steve as well. But after me. (Sorry, Steve.)
I’m not an enormous fan of most of the assessment we use as most grades are meaningless, assessment becomes part of a carrot-and-stick approach and it’s all based on artificial timelines that stifle creativity. (But apart from that, it’s fine. Ho ho.) My pithy statement on this is that if you build an adversarial educational system, you’ll get adversaries, but if you bother to build a learning environment, you’ll get learning. One of the natural outcomes of an adversarial system is activities like cheating and gaming the system, because people start to treat beating the system as the goal itself, which is highly undesirable. You can read a lot more about my views on plagiarism here, if you like. (Warning: that post links to several others and is a bit of a wormhole.)
Now, let’s hear what Eric has to say on this! (My comments from this point on will attempt to contain themselves in parentheses. You can find the slides for his talk – all 62MB of them – from this link on his website. ) It’s important to remember that one of the reasons that Eric’s work is so interesting is that he is looking for evidence-based approaches to education.
Eric discussed the use of flashcards. A week after Flashcard study, students retain 35%. After two weeks, it’s almost gone. He tried to communicate this to someone who was launching a cloud-based flashcard app. Her response was “we only guarantee they’ll pass the test”.
*low, despairing chuckle from the audience*
Of course most students study to pass the test, not to learn, and they are not the same thing. For years, Eric has been bashing the lecture (yes, he noted the irony) but now he wants to focus on changing assessment and getting it away from rote learning and regurgitation. The assessment practices we use now are not 21st century focused, they are used for ranking and classifying but, even then, doing it badly.
So why are we assessing? What are the problems that are rampant in our assessment procedure? What are the improvements we can make?
How many different purposes of assessment can you think of? Eric gave us 90s to come up with a list. Katrina and I came up with about 10, most of which were serious, but it was an interesting question to reflect upon. (Eric snuck
- Rate and rank students
- Rate professor and course
- Motivate students to keep up with work
- Provide feedback on learning to students
- Provide feedback to instructor
- Provide instructional accountability
- Improve the teaching and learning.
Ah, but look at the verbs – they are multi-purpose and in conflict. How can one thing do so much?
So what are the problems? Many tests are fundamentally inauthentic – regurgitation in useless and inappropriate ways. Many problem-solving approaches are inauthentic as well (a big problem for computing, we keep writing “Hello, World”). What does a real problem look like? It’s an interruption in our pathway to our desired outcome – it’s not the outcome that’s important, it’s the pathway and the solution to reach it that are important. Typical student problem? Open the book to chapter X to apply known procedure Y to determine an unknown answer.
Shout out to Bloom’s! Here’s Eric’s slide to remind you.
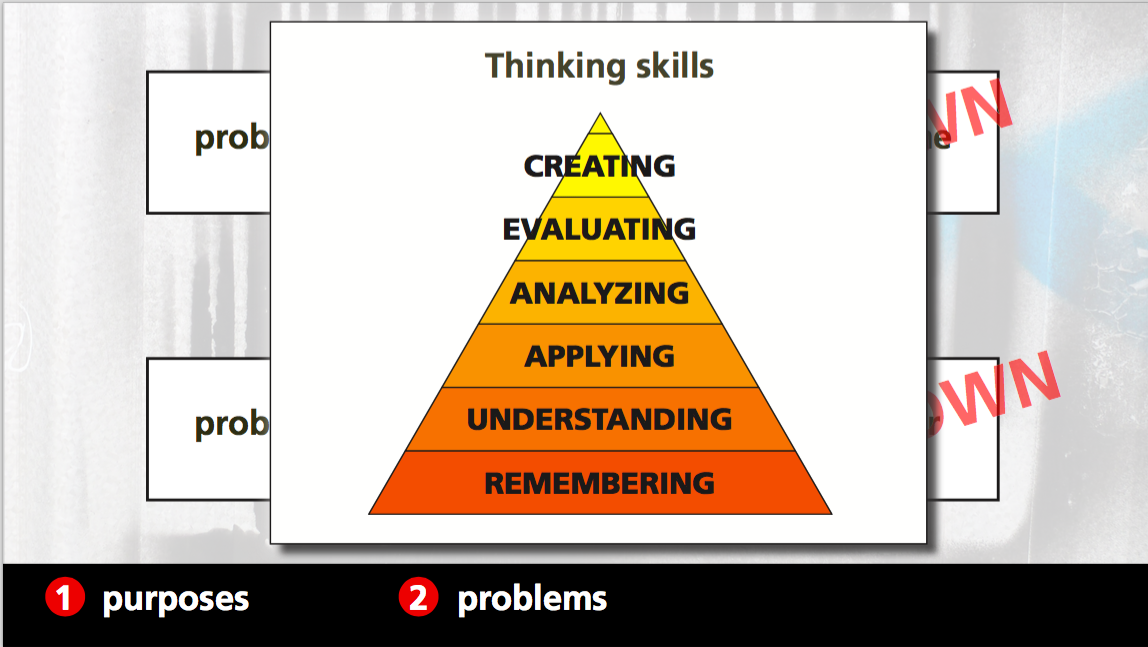
Rights reside with Eric Mazur.
Eric doesn’t think that many of us, including Harvard, even reach the Applying stage. He referred to a colleague in physics who used baseball problems throughout the course in assignments, until he reached the final exam where he ran out of baseball problems and used football problems. “Professor! We’ve never done football problems!” Eric noted that, while the audience were laughing, we should really be crying. If we can’t apply what we’ve learned then we haven’t actually learned i.
Eric sneakily put more audience participation into the talk with an open ended question that appeared to not have enough information to come up with a solution, as it required assumptions and modelling. From a Bloom’s perspective, this is right up the top.
Students loathe assumptions? Why? Mostly because we’ll give them bad marks if they get it wrong. But isn’t the ability to make assumptions a really important skill? Isn’t this fundamental to success?
Eric demonstrated how to tame the problem by adding in more constraints but this came at the cost of the creating stage of Bloom’s and then the evaluating and analysing. (Check out his slides, pages 31 to 40, for details of this.) If you add in the memorisation of the equation, we have taken all of the guts out of the problem, dropping down to the lowest level of Bloom’s.
But, of course, computers can do most of the hard work for that is mechanistic. Problems at the bottom layer of Bloom’s are going to be solved by machines – this is not something we should train 21st Century students for.
But… real problem solving is erratic. Riddled with fuzziness. Failure prone. Not guaranteed to succeed. Most definitely not guaranteed to be optimal. The road to success is littered with failures.
But, if you make mistakes, you lose marks. But if you’re not making mistakes, you’re very unlikely to be creative and innovative and this is the problem with our assessment practices.
Eric showed us a stress of a traditional exam room: stressful, isolated, deprived of calculators and devices. Eric’s joke was that we are going to have to take exams naked to ensure we’re not wearing smart devices. We are in a time and place where we can look up whatever we want, whenever we want. But it’s how you use that information that makes a difference. Why are we testing and assessing students under such a set of conditions? Why do we imagine that the result we get here is going to be any indicator at all of the likely future success of the student with that knowledge?
Cramming for exams? Great, we store the information in short-term memory. A few days later, it’s all gone.
Assessment produces a conflict, which Eric noticed when he started teaching a team and project based course. He was coaching for most of the course, switching to a judging role for the monthly fair. He found it difficult to judge them because he had a coach/judge conflict. Why do we combine it in education when it would be unfair or unpleasant in every other area of human endeavour? We hide between the veil of objectivity and fairness. It’s not a matter of feelings.
But… we go back to Bloom’s. The only thinking skill that can be evaluated truly objectively is remembering, at the bottom again.
But let’s talk about grade inflation and cheating. Why do people cheat at education when they don’t generally cheat at learning? But educational systems often conspire to rob us of our ownership and love of learning. Our systems set up situations where students cheat in order to succeed.
- Mimic real life in assessment practices!
Open-book exams. Information sticks when you need it and use it a lot. So use it. Produce problems that need it. Eric’s thought is you can bring anything you want except for another living person. But what about assessment on laptops? Oh no, Google access! But is that actually a problem? Any question to which the answer can be Googled is not an authentic question to determine learning!
Eric showed a video of excited students doing a statistic tests as a team-based learning activity. After an initial pass at the test, the individual response is collected (for up to 50% of the grade), and then students work as a group to confirm the questions against an IF AT scratchy card for the rest of the marks. Discussion, conversation, and the students do their own grading for you. They’ve also had the “A-ha!” moment. Assessment becomes a learning opportunity.
Eric’s not a fan of multiple choice so his Learning Catalytics software allows similar comparison of group answers without having to use multiple choice. Again, the team based activities are social, interactive and must less stressful.
- Focus on feedback, not ranking.
Objective ranking is a myth. The amount of, and success with, advanced education is no indicator of overall success in many regards. So why do we rank? Eric showed some graphs of his students (in earlier courses) plotting final grades in physics against the conceptual understanding of force. Some people still got top grades without understanding force as it was redefined by Newton. (For those who don’t know, Aristotle was wrong on this one.) Worse still is the student who mastered the concept of force and got a C, when a student who didn’t master force got an A. Objectivity? Injustice?
- Focus on skills, not content
Eric referred to Wiggins and McTighe, “Understanding by Design.” Traditional approach is course content drives assessment design. Wiggins advocates identifying what the outcomes are, formulate these as action verbs, ‘doing’ x rather than ‘understanding’ x. You use this to identify what you think the acceptable evidence is for these outcomes and then you develop the instructional approach. This is totally outcomes based.
- resolve coach/judge conflict
In his project-based course, Eric brought in external evaluators, leaving his coach role unsullied. This also validates Eric’s approach in the eyes of his colleagues. Peer- and self-evaluation are also crucial here. Reflective time to work out how you are going is easier if you can see other people’s work (even anonymously). Calibrated peer review, cpr.molsci.ucla.edu, is another approach but Eric ran out of time on this one.
If we don’t rethink assessment, the result of our assessment procedures will never actually provide vital information to the learner or us as to who might or might not be successful.
I really enjoyed this talk. I agree with just about all of this. It’s always good when an ‘internationally respected educator’ says it as then I can quote him and get traction in change-driving arguments back home. Thanks for a great talk!
The driverless car is more than transportation technology.
Posted: May 4, 2015 Filed under: Education, Opinion | Tags: AI, blogging, community, data visualisation, driverless car, driverless cars, education, educational problem, Elon Musk, higher education, in the student's head, measurement, principles of design, robots, teaching, teaching approaches, thinking, universal principles of design 1 CommentI’m hoping to write a few pieces on design in the coming days. I’ll warn you now that one of them will be about toilets, so … urm … prepare yourself, I guess? Anyway, back to today’s theme: the driverless car. I wanted to talk about it because it’s a great example of what technology could do, not in terms of just doing something useful but in terms of changing how we think. I’m going to look at some of the changes that might happen. No doubt many of you will have ideas and some of you will disagree so I’ll wait to see what shows up in the comments.
Humans have been around for quite a long time but, surprisingly given how prominent they are in our lives, cars have only been around for 120 years in the form that we know them – gasoline/diesel engines, suspension and smaller-than-buggy wheels. And yet our lives are, in many ways, built around them. Our cities bend and stretch in strange ways to accommodate roads, tunnels, overpasses and underpasses. Ask anyone who has driven through Atlanta, Georgia, where an Interstate of near-infinite width can be found running from Peachtree & Peachtree to Peachtree, Peachtree, Peachtree and beyond!
But what do we think of when we think of cars? We think of transportation. We think of going where we want, when we want. We think of using technology to compress travel time and this, for me, is a classic human technological perspective because we are love to amplify. Cars make us faster. Computers allow us to add up faster. Guns help us to kill better.
So let’s say we get driverless cars and, over time, the majority of cars on the road are driverless. What does this mean? Well, if you look at road safety stats and the WHO reports, you’ll see that about up 40% of traffic fatalities can be straight line accidents (these figures from the Victorian roads department, 2006-2013). That is, people just drive off a straight road and kill themselves. The leading killers overall are alcohol, fatigue, and speed. Driverless cars will, in one go, remove all of these. Worldwide, a million people per year just stopped dying.
But it’s not just transportation. In America, commuting to work eats up from 35-65 hours of your year. If you live in DC, you spend two weeks every year cursing the Beltway. And it’s not as if you can easily work in your car so those are lost hours. That’s not enjoyable driving! That’s hours of frustration, wasted fuel, exposure to burning fuel, extra hours you have to work. The fantasy of the car is driving a convertible down the Interstate in the sunshine, listening to rock, and singing along. The reality is inching forward with the windows up in a 10 year old Nissan family car while stuck between FM stations and having to listen to your second iPod because the first one’s out of power. And it’s the joke one that only has Weird Al on it.
Enter the driverless car. Now you can do some work but there’s no way that your commute will be as bad anyway because we can start to do away with traffic lights and keep the traffic moving. You’ll be there for less time but you can do more. Have a sleep if you want. Learn a language. Do a MOOC! Winning!
Why do I think it will be faster? Every traffic light has a period during which no-one is moving. Why? Because humans need clear signals and need to know what other drivers are doing. A driverless car can talk to other cars and they can weave in and out of the traffic signals. Many traffic jams are caused by people hitting the brakes and then people arrive at this braking point faster than people are leaving. There is no need for this traffic jam and, with driverless cars, keeping distance and speed under control is far easier. Right now, cars move like ice through a vending machine. We want them to move like water.
How will you work in your car? Why not make every driverless car a wireless access point using mesh networking? Now the more cars you get together, the faster you can all work. The I495 Beltway suddenly becomes a hub of activity rather than a nightmare of frustration. (In a perfect world, aliens come to Earth and take away I495 as their new emperor, leaving us with matter transporters, but I digress.)
But let’s go further. Driverless cars can have package drops in them. The car that picks you up from work has your Amazon parcels in the back. It takes meals to people who can’t get out. It moves books around.
But let’s go further. Make them electric and put some of Elon’s amazing power cells into them and suddenly we have a power transportation system if we can manage the rapid charge/discharge issues. Your car parks in the city turn into repair and recharge facilities for fleets of driverless cars, charging from the roof solar and wind, but if there’s a power problem, you can send 1000 cars to plug into the local grid and provide emergency power.
We still need to work out some key issues of integration: cyclists, existing non-converted cars and pedestrians are the first ones that come to mind. But, in my research group, we have already developed passive localisation that works on a scale that could easily be put onto cars so you know when someone is among the cars. Combine that with existing sensors and all a cyclist has to do is to wear a sensor (non-personalised, general scale and anonymised) that lets intersections know that she is approaching and the cars can accommodate it. Pedestrians are slow enough that cars can move around them. We know that they can because slow humans do it often enough!
We start from ‘what could we do if we produced a driverless car’ and suddenly we have free time, increased efficiency and the capacity to do many amazing things.
Now, there are going to be protests. There are going to be people demanding their right to drive on the road and who will claim that driverless cars are dangerous. There will be anti-robot protests. There already have been. I expect that the more … freedom-loving states will blow up a few of these cars to make a point. Anyone remember the guy waving a red flag who had to precede every automobile? It’s happened before. It will happen again.
We have to accept that there are going to be deaths related to this technology, even if we plan really hard for it not to happen, and it may be because of the technology or it may be because of opposing human action. But cars are already killing so may people. 1.2 million people died on the road in 2010, 36,000 from America. We have to be ready for the fact that driverless cars are a stepping stone to getting people out of the grind of the commute and making much better use of our cities and road spaces. Once we go driverless we need to look at how many road accidents aren’t happening, and address the issues that still cause accidents in a driverless example.
Understand the problem. Measure what’s happening. Make a change. Measure again. Determine the impact.
When we think about keeping the manually driven cars on the road, we do have a precedent. If you look at air traffic, the NTSB Accidents and Accident Rates by NTSB Classification 1998-2007 report tells us that the most dangerous type of flying is small private planes, which are more than 5 times more likely to have an accident than commercial airliners. Maybe it will be the insurance rates or the training required that will reduce the private fleet? Maybe they’ll have overrides. We have to think about this.
It would be tempting to say “why still have cars” were it not for the increasingly ageing community, those people who have several children and those people who have restricted mobility, because they can’t just necessarily hop on a bike or walk. As someone who has had multiple knee surgeries, I can assure you that 100m is an insurmountable distance sometimes – and I used to run 45km up and down mountains. But what we can do is to design cities that work for people and accommodate the new driverless cars, which we can use in a much quieter, efficient and controlled manner.
Vehicles and people can work together. The Denver area, Bahnhofstrasse in Zurich and Bourke Street Mall in Melbourne are three simple examples where electric trams move through busy pedestrian areas. Driverless cars work like trams – or they can. Predictable, zoned and controlled. Better still, for cyclists, driverless cars can accommodate sharing the road much more easily although, as noted, there may still be some issues for traffic control that will need to be ironed out.
It’s easy to look at the driverless car as just a car but this is missing all of the other things we could be doing. This is just one example where the replacement of something ubiquitous that might just change the world for the better.
Think. Create. Code. Vis! (@edXOnline, @UniofAdelaide, @cserAdelaide, @code101x, #code101x)
Posted: April 30, 2015 Filed under: Education, Opinion | Tags: #code101x, advocacy, blogging, collaboration, community, curriculum, data visualisation, education, educational problem, educational research, edx, higher education, learning, measurement, MOOC, moocs, reflection, resources, teaching, teaching approaches, thinking, tools, universal principles of design Leave a commentI just posted about the massive growth in our new on-line introductory programming course but let’s look at the numbers so we can work out what’s going on and, maybe, what led to that level of success. (Spoilers: central support from EdX helped a huge amount.) So let’s get to the data!
I love visualised data so let’s look at the growth in enrolments over time – this is really simple graphical stuff as we’re spending time getting ready for the course at the moment! We’ve had great support from the EdX team through mail-outs and Twitter and you can see these in the ‘jumps’ in the data that occurred at the beginning, halfway through April and again at the end. Or can you?

Rapid growth in enrolment! But it’s a little hard to see in this data.
Hmm, this is a large number, so it’s not all that easy to see the detail at the end. Let’s zoom in and change the layout of the data over to steps so we can things more easily. (It’s worth noting that I’m using the free R statistical package to do all of this. I can change one line in my R program and regenerate all of my graphs and check my analysis. When you can program, you can really save time on things like this by using tools like R.)

Now you can see where that increase started and then the big jump around the time that e-mail advertising started, circled. That large spike at the end is around 1500 students, which means that we jumped 10% in a day.
When we started looking at this data, we wanted to get a feeling for how many students we might get. This is another common use of analysis – trying to work out what is going to happen based on what has already happened.
As a quick overview, we tried to predict the future based on three different assumptions:
- that the growth from day to day would be roughly the same, which is assuming linear growth.
- that the growth would increase more quickly, with the amount of increase doubling every day (this isn’t the same as the total number of students doubling every day).
- that the growth would increase even more quickly than that, although not as quickly as if the number of students were doubling every day.
If Assumption 1 was correct, then we would expect the graph to look like a straight line, rising diagonally. It’s not. (As it is, this model predicted that we would only get 11,780 students. We crossed that line about 2 weeks ago.
So we know that our model must take into account the faster growth, but those leaps in the data are changes that caused by things outside of our control – EdX sending out a mail message appears to cause a jump that’s roughly 800-1,600 students, and it persists for a couple of days.
Let’s look at what the models predicted. Assumption 2 predicted a final student number around 15,680. Uhh. No. Assumption 3 predicted a final student number around 17,000, with an upper bound of 17,730.
Hmm. Interesting. We’ve just hit 17,571 so it looks like all of our measures need to take into account the “EdX” boost. But, as estimates go, Assumption 3 gave us a workable ballpark and we’ll probably use it again for the next time that we do this.
Now let’s look at demographic data. We now we have 171-172 countries (it varies a little) but how are we going for participation across gender, age and degree status? Giving this information to EdX is totally voluntary but, as long as we take that into account, we make some interesting discoveries.
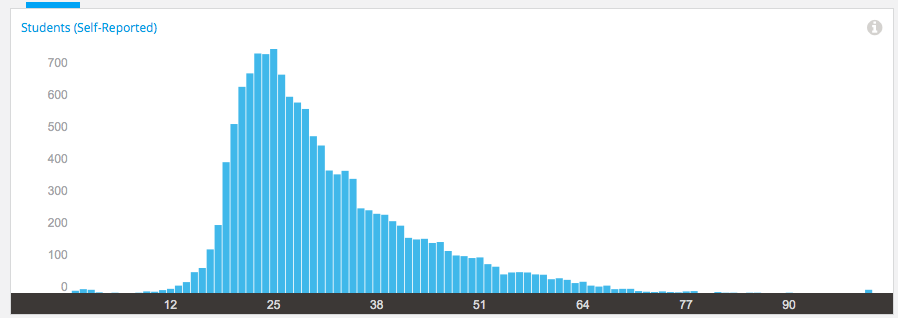
Age demographic data from EdX
Our median student age is 25, with roughly 40% under 25 and roughly 40% from 26 to 40. That means roughly 20% are 41 or over. (It’s not surprising that the graph sits to one side like that. If the left tail was the same size as the right tail, we’d be dealing with people who were -50.)
The gender data is a bit harder to display because we have four categories: male, female, other and not saying. In terms of female representation, we have 34% of students who have defined their gender as female. If we look at the declared male numbers, we see that 58% of students have declared themselves to be male. Taking into account all categories, this means that our female participant percentage could be as high as 40% but is at least 34%. That’s much higher than usual participation rates in face-to-face Computer Science and is really good news in terms of getting programming knowledge out there.
We’re currently analysing our growth by all of these groupings to work out which approach is the best for which group. Do people prefer Twitter, mail-out, community linkage or what when it comes to getting them into the course.
Anyway, lots more to think about and many more posts to come. But we’re on and going. Come and join us!
Musing on Industrial Time
Posted: April 20, 2015 Filed under: Education, Opinion | Tags: advocacy, authenticity, blogging, community, curriculum, design, education, educational problem, educational research, ethics, higher education, in the student's head, learning, measurement, principles of design, reflection, resources, student perspective, teaching, teaching approaches, thinking, time banking, universal principles of design, work/life balance, workload 3 Comments
I caught up with a good friend recently and we were discussing the nature of time. She had stepped back from her job and was now spending a lot of her time with her new-born son. I have gone to working three days a week, hence have also stepped back from the five-day grind. It was interesting to talk about how this change to our routines had changed the way that we thought of and used time. She used a term that I wanted to discuss here, which was industrial time, to describe the clock-watching time of the full-time worker. This is part of the larger area of time discipline, how our society reacts to and uses time, and is really quite interesting. Both of us had stopped worrying about the flow of time in measurable hours on certain days and we just did things until we ran out of day. This is a very different activity from the usual “do X now, do Y in 15 minutes time” that often consumes us. In my case, it took me about three months of considered thought and re-training to break the time discipline habits of thirty years. In her case, she has a small child to help her to refocus her time sense on the now.
Modern time-sense is so pervasive that we often don’t think about some of the underpinnings of our society. It is easy to understand why we have years and, although they don’t line up properly, months given that these can be matched to astronomical phenomena that have an effect on our world (seasons and tides, length of day and moonlight, to list a few). Days are simple because that’s one light/dark cycle. But why there are 52 weeks in a year? Why are there 7 days in a week? Why did the 5-day week emerge as a contiguous block of 5 days? What is so special about working 9am to 5pm?
A lot of modern time descends from the struggle of radicals and unionists to protect workers from the excesses of labour, to stop people being worked to death, and the notion of the 8 hour day is an understandable division of a 24 hour day into three even chunks for work, rest and leisure. (Goodness, I sound like I’m trying to sell you chocolate!)
If we start to look, it turns out that the 7 day week is there because it’s there, based on religion and tradition. Interestingly enough, there have been experiments with other week lengths but it appears hard to shift people who are used to a certain routine and, tellingly, making people wait longer for days off appears to be detrimental to adoption.
If we look at seasons and agriculture, then there is a time to sow, to grow, to harvest and to clear, much as there is a time for livestock to breed and to be raised for purpose. If we look to the changing time of sunrise and sunset, there is a time at which natural light is available and when it is not. But, from a time discipline perspective, these time systems are not enough to be able to build a large-scale, industrial and synchronised society upon – we must replace a distributed, loose and collective notion of what time is with one that is centralised, authoritarian and singular. While religious ceremonies linked to seasonal and astronomical events did provide time-keeping on a large scale prior to the industrial revolution, the requirement for precise time, of an accuracy to hours and minutes, was not possible and, generally, not required beyond those cues given from nature such as dawn, noon, dusk and so on.
After the industrial revolution, industries and work was further developed that was heavily separated from a natural linkage – there are no seasons for a coal mine or a steam engine – and the development of the clock and reinforcement of the calendar of work allowed both the measurement of working hours (for payment) and the determination of deadlines, given that natural forces did not have to be considered to the same degree. Steam engines are completed, they have no need to ripen.
With the notion of fixed and named hours, we can very easily determine if someone is late when we have enough tools for measuring the flow of time. But this is, very much, the notion of the time that we use in order to determine when a task must be completed, rather than taking an approach that accepts that the task will be completed at some point within a more general span of time.
We still have confusion where our understanding of “real measures” such as days, interact with time discipline. Is midnight on the 3rd of April the second after the last moment of April the 2nd or the second before the first moment of April the 4th? Is midnight 12:00pm or 12:00am? (There are well-defined answers to this but the nature of the intersection is such that definitions have to be made.)
But let’s look at teaching for a moment. One of the great criticisms of educational assessment is that we confuse timeliness, and in this case we specifically mean an adherence to meeting time discipline deadlines, with achievement. Completing the work a crucial hour after it is due can lead to that work potentially not being marked at all, or being rejected. But we do usually have over-riding reasons for doing this but, sadly, these reasons are as artificial as the deadlines we impose. Why is an Engineering Degree a four-year degree? If we changed it to six would we get better engineers? If we switched to competency based training, modular learning and life-long learning, would we get more people who were qualified or experienced with engineering? Would we get less? What would happen if we switched to a 3/1/2/1 working week? Would things be better or worse? It’s hard to evaluate because the week, and the contiguous working week, are so much a part of our world that I imagine that today is the first day that some of you have thought about it.
Back to education and, right now, we count time for our students because we have to work out bills and close off accounts at end of financial year, which means we have to meet marking and award deadlines, then we have to project our budget, which is yearly, and fit that into accredited degree structures, which have year guidelines…
But I cannot give you a sound, scientific justification for any of what I just wrote. We do all of that because we are caught up in industrial time first and we convince ourselves that building things into that makes sense. Students do have ebb and flow. Students are happier on certain days than others. Transition issues on entry to University are another indicator that students develop and mature at different rates – why are we still applying industrial time from top to bottom when everything we see here says that it’s going to cause issues?
Oh, yes, the “real world” uses it. Except that regular studies of industrial practice show that 40 hour weeks, regular days off, working from home and so on are more productive than the burn-out, everything-late, rush that we consider to be the signs of drive. (If Henry Ford thinks that making people work more than 40 hours a week is bad for business, he’s worth listening to.) And that’s before we factor in the development of machines that will replace vast numbers of human jobs in the next 20 years.
I have a different approach. Why aren’t we looking at students more like we regard our grape vines? We plan, we nurture, we develop, we test, we slowly build them to the point where they can produce great things and then we sustain them for a fruitful and long life. When you plant grape vines, you expect a first reasonable crop level in three years, and commercial levels at five. Tellingly, the investment pattern for grapes is that it takes you 10 years to break even and then you start making money back. I can’t tell you how some of my students will turn out until 15-25 years down the track and it’s insanity to think you can base retrospective funding on that timeframe.
You can’t make your grapes better by telling them to be fruitful in two years. Some vines take longer than others. You can’t even tell them when to fruit (although can trick them a little). Yet, somehow, we’ve managed to work around this to produce a local wine industry worth around $5 billion dollars. We can work with variation and seasonal issues.
One of the reasons I’m so keen on MOOCs is that these can fit in with the routines of people who can’t dedicate themselves to full-time study at the moment. By placing well-presented, pedagogically-sound materials on-line, we break through the tyranny of the 9-5, 5 day work week and let people study when they are ready to, where they are ready to, for as long as they’re ready to. Like to watch lectures at 1am, hanging upside down? Go for it – as long as you’re learning and not just running the video in the background while you do crunches, of course!
Once you start to question why we have so many days in a week, you quickly start to wonder why we get so caught up on something so artificial. The simple answer is that, much like money, we have it because we have it. Perhaps it’s time to look at our educational system to see if we can do something that would be better suited to developing really good knowledge in our students, instead of making them adept at sliding work under our noses a second before it’s due. We are developing systems and technologies that can allow us to step outside of these structures and this is, I believe, going to be better for everyone in the process.
Conformity isn’t knowledge, and conformity to time just because we’ve always done that is something we should really stop and have a look at.
101 Big And Small Ways To Make A Difference In Academia
Posted: January 5, 2015 Filed under: Education | Tags: activism, advocacy, authenticity, blogging, community, education, educational problem, ethics, higher education, resources, students, teaching, teaching approaches, thinking, universal principles of design, workload Leave a commentThis is a quite remarkable list of ideas that I found only today. Please invest some time to read through it as you can probably find something that speaks to you about making a difference in Academia.

101 Big And Small Ways To Make A Difference In Academia.
Ending the Milling Mindset
Posted: November 17, 2014 Filed under: Education, Opinion | Tags: advocacy, authenticity, community, curriculum, design, education, educational problem, educational research, ethics, failure rate, grand challenge, higher education, in the student's head, learning, measurement, reflection, resources, student perspective, students, teaching, teaching approaches, thinking, tools, universal principles of design 7 CommentsThis is the second in a set of posts that are critical of current approaches to education. In this post, I’m going to extend the idea of rejecting an industrial revolutionary model of student production and match our new model for manufacturing, additive processes, to a new way to produce students. (I note that this is already happening in a number of places, so I’m not claiming some sort of amazing vision here, but I wanted to share the idea more widely.)
Traditional statistics is often taught with an example where you try to estimate how well a manufacturing machine is performing by measuring its outputs. You determine the mean and variation of the output and then use some solid calculations to then determine if the machine is going to produce a sufficient number of accurately produced widgets to keep your employers at WidgetCo happy. This is an important measure for things such as getting the weight right across a number of bags of rice or correctly producing bottles that hold the correct volume of wine. (Consumers get cranky if some bags are relatively empty or they have lost a glass of wine due to fill variations.)
If we are measuring this ‘fill’ variation, then we are going to expect deviation from the mean in two directions: too empty and too full. Very few customers are going to complain about too much but the size of the variation can rarely be constrained in just one direction, so we need to limit how widely that fill needle swings. Obviously, it is better to be slightly too full (on average) than too empty (on average) although if we are too generous then the producer loses money. Oh, money, how you make us think in such scrubby, little ways.
When it comes to producing items, rather than filling, we often use a machine milling approach, where a block of something is etched away through mechanical or chemical processes until we are left with what we want. Here, our tolerance for variation will be set based on the accuracy of our mill to reproduce the template.
In both the fill and the mill cases, imagine a production line that travels on a single pass through loading, activity (fill/mill) and then measurement to determine how well this unit conforms to the desired level. What happens to those items that don’t meet requirements? Well, if we catch them early enough then, if it’s cost effective, we can empty the filled items back into a central store and pass them through again – but this is wasteful in terms of cost and energy, not to mention that contents may not be able to be removed and then put back in again. In the milling case, the most likely deviance is that we’ve got the milling process wrong and taken away things in the wrong place or to the wrong extent. Realistically, while some cases of recycling the rejects can occur, a lot of rejected product is thrown away.
If we run our students as if they are on a production line along these lines then, totally unsurprisingly, we start to set up a nice little reject pile of our own. The students have a single pass through a set of assignments, often without the ability to go and retake a particular learning activity. If they fail sufficient of these tests, then they don’t meet our requirements and they are rejected from that course. Now some students will over perform against our expectations and, one small positive, they will then be recognised as students of distinction and not rejected. However, if we consider our student failure rate to reflect our production wastage, then failure rates of 20% or higher start to look a little… inefficient. These failure rates are only economically manageable (let us switch off our ethical brains for a moment) if we have enough students or they are considered sufficiently cheap that we can produce at 80% and still make money. (While some production lines would be crippled by a 10% failure rate, for something like electric drive trains for cars, there are some small and cheap items where there is a high failure rate but the costing model allows the business to stay economical.) Let us be honest – every University in the world is now concerned with their retention and progression rates, which is the official way of saying that we want students to stay in our degrees and pass our courses. Maybe the single pass industrial line model is not the best one.

Why carve back to try to reveal people, when we could build people up instead?
Enter the additive model, via the world of 3D printing. 3D printing works by laying down the material from scratch and producing something where there is no wastage of material. Each item is produced as a single item, from the ground up. In this case, problems can still occur. The initial track of plastic/metal/material may not adhere to the plate and this means that the item doesn’t have a solid base. However, we can observe this and stop printing as soon as we realise this is occurring. Then we try again, perhaps using a slightly different approach to get the base to stick. In student terms, this is poor transition from the school environment, because nothing is sticking to the established base! Perhaps the most important idea, especially as we develop 3D printing techniques that don’t require us to deposit in sequential layers but instead allows us to create points in space, is that we can identify those areas where a student is incomplete and then build up that area.
In an additive model, we identify a deficiency in order to correct rather than to reject. The growing area of learning analytics gives us the ability to more closely monitor where a student has a deficiency of knowledge or practice. However, such identification is useless unless we then act to address it. Here, a small failure has become something that we use to make things better, rather than a small indicator of the inescapable fate of failure later on. We can still identify those students who are excelling but, now, instead of just patting them on the back, we can build them up in additional interesting ways, should they wish to engage. We can stop them getting bored by altering the challenge as, if we can target knowledge deficiency and address that, then we must be able to identify extension areas as well – using the same analytics and response techniques.
Additive manufacturing is going to change the way the world works because we no longer need to carve out what we want, we can build what we want, on demand, and stop when it’s done, rather than lamenting a big pile of wood shavings that never amounted to a table leg. A constructive educational focus rejects high failure rates as being indicative of missed opportunities to address knowledge deficiencies and focuses on a deep knowledge of the student to help the student to build themselves up. This does not make a course simpler or drop the quality, it merely reduces unnecessary (and uneconomical) wastage. There is as much room for excellence in an additive educational framework – if anything, you should get more out of your high achievers.
We stand at a very interesting point in history. It is time to revisit what we are doing and think about what we can learn from the other changes going on in the world, especially if it is going to lead to better educational results.
Data: Harder to Anonymise Yourself Than You Might Think
Posted: October 18, 2014 Filed under: Education, Opinion | Tags: Black Static, blogging, community, curriculum, data, data visualisation, education, feedback, higher education, Interzone, measurement, reflection, submission, submission system, teaching, teaching approaches, thinking, universal principles of design Leave a commentThere’s a lot of discussion around a government’s use of metadata at the moment, where instead of looking at the details of your personal data, government surveillance is limited to looking at the data associated with your personal data. In the world of phone calls, instead of taping the actual call, they can see the number you dialled, the call time and its duration, for example. CBS have done a fairly high-level (weekend-suitable) coverage of a Stanford study that quickly revealed a lot more about participants than they would have thought possible from just phone numbers and call times.
But how much can you tell about a person or an organisation without knowing the details? I’d like to show you a brief, but interesting, example. I write fiction and I’ve recently signed up to “The Submission Grinder“, which allows you to track your own submissions and, by crowdsourcing everyone’s success and failures, to also track how certain markets are performing in terms of acceptance, rejection and overall timeliness.
Now, I have access to no-one else’s data but my own (which is all of 5 data points) but I’ll show you how assembling these anonymous data results together allows me to have a fairly good stab at determining organisational structure and, in one case, a serious organisational transformation.
Let’s start by looking at a fairly quick turnover semi-pro magazine, Black Static. It’s a short fiction market with horror theming. Here’s their crowd-sourced submission graph for response times, where rejections are red and acceptances are green. (Sorry, Damien.)
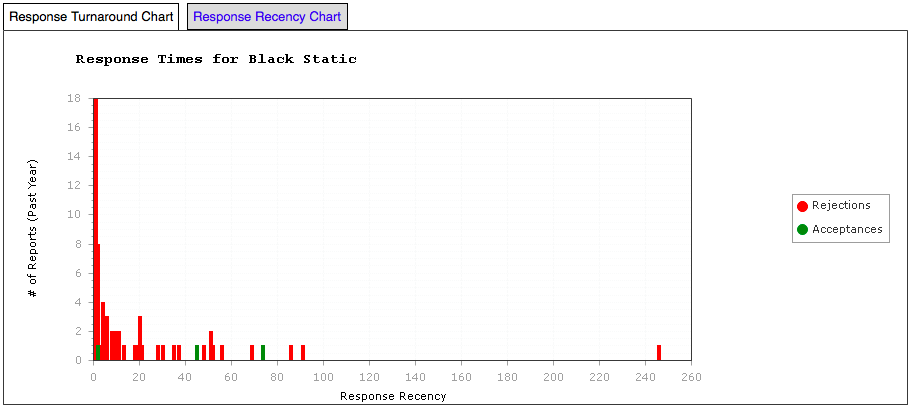
Black Static – Response Time Graph
Black Static has a web submission system and, as you can see, most rejections happen in the first 2-3 weeks. There is then a period where further work goes on. (It’s very important to note that this is a sample generated by those people who are using Submission Grinder, which is a subset of all people submitting to Black Static.) What this looks like, given that it is unlikely that anyone could read a lot 4,000-7,000 manuscripts in detail at a time, is that the editor is skimming the electronic slush pile to determine if it’s worth going to other readers. After this initial 2 week culling, what we are seeing is the result of further reading so we’d probably guess that the readers’ reviews are being handled as they come in, with some indication that this is one roughly weekly – maybe as a weekend job? It’s hard to say because there’s not much data beyond 21 days so we’re guessing.
Let’s look at Black Static’s sister SF magazine, Interzone, now semi-pro but still very highly regarded.

Interzone – Response Time Graph
Lots more data here! Again, there appears to be a fairly fast initial cut-off mechanism from skimming the web submission slush pile. (And I can back this up with actual data as Interzone rejected one of my stories in 24 hours.) Then there appears to be a two week period where some thinking or reading takes place and then there’s a second round of culling, which may be an editorial meeting or a fast reader assignment. Finally we see two more fortnightly culls as the readers bring back their reviews. I think there’s enough data here to indicate that Interzone’s editorial group consider materials most often every fortnight. Also the acceptances generated by positive reviews appear to be the same quantity as those from the editors – although there’s so little data here we’re really grabbing at tempting looking straws.
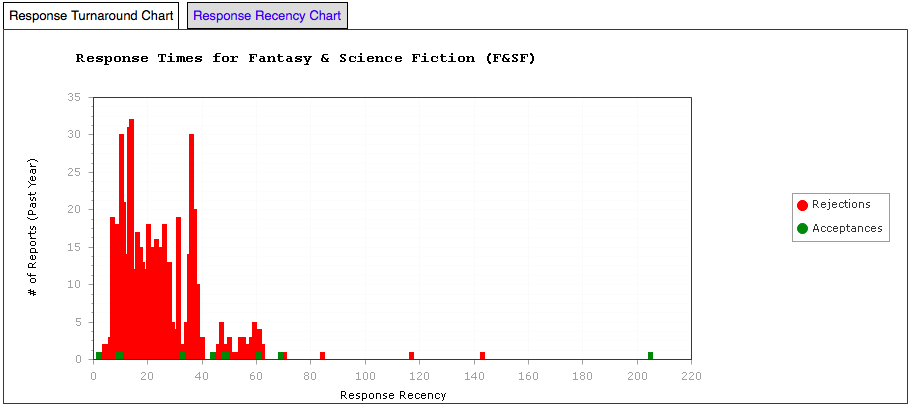
Now let’s look at two pro markets, starting with the Magazine of Fantasy & Science Fiction.
Fantasy & Science Fiction – Response Time Graph
This doesn’t have the same initial culling process that the other two had, although it appears that there is a period of 7-14 days when a lot of work has been reviewed and then rejected – we don’t see as much work rejected again until the 35 day mark, when it looks like all reader reviews are back. Notably, there is a large gap between the initial bunch of acceptances (editor says ‘yes’) and then acceptances supported by reviewers. I’m speculating now but I wonder if what we’re seeing between that first and second group of acceptances are reviewers who write back in and say “Don’t bother” quickly, rather than assembling personalised feedback for something that could be salvaged. Either way, the message here is simple. If you survive the first four weeks in F&SF system, then you are much less likely to be rejected and, with any luck, this may translate (worse case) into personal suggestions for improvement.
F&SF has a postal submission system, which makes it far more likely that the underlying work is going to batched in some way, as responses have to go out via mail and doing this in a more organised fashion makes sense. This may explain why this is such a high level of response overall for the first 35 days, as you can’t easily click a button to send a response electronically and there’re a finite number of envelopes any one person wants to prepare on any given day. (I have no idea how right I am but this is what I’m limited to by only observing the metadata.)
Tor.com has a very interesting graph, which I’ll show below.
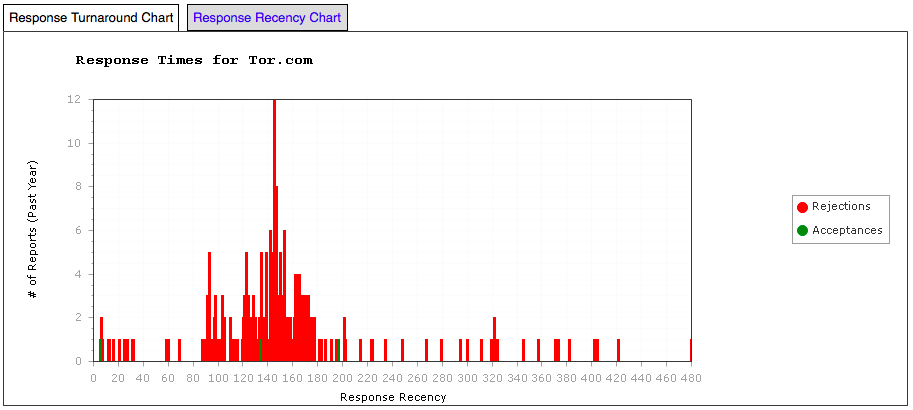
Tor.com – Response Time Graph
Tor.com pays very well and has an on-line submission system via e-mail. As a result, it is positively besieged with responses and their editorial team recently shut down new submissions for two months while they cleared backlog. What interested me in this data was the fact that the 150 day spike was roughly twice as high as the 90 and 120. Hmm – 90, 120, 150 as dominant spikes. Does that sound like a monthly editors’ meeting to anyone else? By looking at the recency graph (which shows activity relative to today) we can see that there has been an amazing flurry of activity at Tor.com in the past month. Tor.com has a five person editorial team (from their website) with reading and support from two people (plus occasional others). It’s hard for five people to reach consensus without discussion so that monthly cycle looks about right. But it will take time for 7 people to read all of that workload, which explains the relative silence until 3 months have elapsed.
What about that spike at 150? It could be the end of the initial decisions and the start of “worth another look” pile so let’s see if their web page sheds any light on it. Aha!
Have you read my story? We reply to everything we’ve finished evaluating, so if you haven’t heard from us, the answer is “probably not.” At this point the vast majority of stories greater than four months old are in our second-look pile, and we respond to almost everything within seven months.
I also wonder if we are seeing previous data where it was taking longer to get decisions made – whether we are seeing two different time management strategies of Tor.com at the same time, being the 90+120 version as well as the 150 version. Looking at the website again.
Response times have improved quite a bit with the expansion of our first reader team (emphasis mine), and we now respond to the vast majority of stories within three months. But all of the stories they like must then be read by the senior editorial staff, who are all full-time editors with a lot on our plates.
So, yes, the size of Tor.com’s slush pile and the number of editors that must agree basically mean that people are putting time aside to make these decisions, now aiming at 90 days, with a bit of spillover. It looks like we are seeing two regimes at once.
All of this information is completely anonymous in terms of the stories, the authors and any actual submission or acceptance patterns that could relate data together. But, by looking at this metadata on the actual submissions, we can now start to get an understanding of the internal operations of an organisation, which in some cases we can then verify with publicly held information.
Now think about all the people you’ve phoned, the length of time that you called them and what could be inferred about your personal organisation from those facts alone. Have a good night’s sleep!
