
Learning Analytics: Far away, so close.
Posted: November 5, 2015 Filed under: Education, Opinion | Tags: blogging, community, data, data analytics, education, educational problem, educational research, focus, higher education, learning, learning analytics, measurement, resources, support, teaching, teaching approaches, thinking, universal principles of design 2 CommentsI’ve been thinking about learning analytics and, while some Unis have managed to solve parts of the problem, I think that we need to confront the complexity of the problem, to explain why it’s so challenging. I break it into five key problems.
- Data. We don’t currently collect enough of it to analyse, what we do collect is of questionable value and isn’t clearly tied to mechanisms, and we have not confronted the spectre of what we do with this data when we get it.
- Mechanisms linking learning and what is produced. The mechanisms are complex. Students could be failing for any number of reasons, not the least of which is crap staff. Trying to work out what has happened by looking at outputs is unlikely to help.
- Focus. Generally, we measure things to evaluate people. This means that students do tests to get marked and, even where we mix this up with formative work, they tend to focus on the things that get them marks. That’s because it’s how we’ve trained them. This focus warps measurement into an enforcement and judgment mechanism, rather than a supportive and constructive mechanism.
- Community. We often mandate or apply analytics as an extension of the evaluation focus above. This means that we don’t have a community who are supported by analytics, we have a community of evaluators and the evaluated. This is what we would usually label as a Panopticon, because of the asymmetrical application of this kind of visibility. And it’s not a great environment for education. Without a strong community, why should staff go to the extra effort to produce the things required to generate more data if they can’t see a need for it? This is a terribly destructive loop as it requires learning analytics to work and be seen as effective before you have the data to make learning analytics work!
- Support. When we actually have the data, understand the mechanism, have the right focus and are linked in to the community, we still need the money, time and other resources to provide remediation, to encourage development, to pay for the technology, to send people to places where they can learn. For students and staff. We just don’t have that.
I think almost all Unis are suffering from the same problems. This is a terribly complex problem and it cannot be solved by technology alone.
It’s certainly not as easy as driving car. You know that you make the car go faster by pushing on one pedal and you make it go slower by pushing on another. You look at your speedometer. This measures how often your wheels are rotating and, by simple arithmetic, gives you your speed across the road. Now you can work out the speed you want to travel at, taking into account signs, conditions and things like that. Simple. But this simple, everyday, action and its outcomes are the result of many, many technological, social and personal systems interacting.
The speedometer in the car is giving you continuously available, and reasonably reliable, data on your performance. You know how to influence that performance through the use of simple and direct controls (mechanism). There exists a culture of driver training, road signage and engineering, and car design that provides you with information that ties your personal performance to external achievement (These are all part of support, focus and community). Finally, there are extrinsic mechanisms that function as checks and balances but, importantly, they are not directly tied to what you are doing in the car, although there are strong causative connections to certain outcomes (And we can see elements of support and community in this as we all want to drive on safe roads, hence state support for this is essential).
We are nowhere near the car scenario with learning analytics right now. We have some measurements of learning in the classroom because we grade assignments and mark exams. But these are not continuous feedback, to be consulted wherever possible, and the mechanisms to cause positive change in these are not necessarily clear and direct. I would argue that most of what we currently do is much closer to police enforcement of speed. We ask students to drive a track and, periodically, we check to see if they’re doing the correct speed. We then, often irrevocably from a grading sense, assign a mark to how well they are driving the track and settle back to measure them again later.
Learning analytics faces huge problems before it reaches this stage. We need vast quantities of data that we are not currently generating. Many University courses lack opportunities to demonstrate prowess early on. Many courses offer only two or three measurements of performance to determine the final grade. This trying to guess our speed when the speedo only lights up every three to four weeks after we have pressed a combination of pedals.
The mechanisms for improvement and performance control in University education are not just murky, they’re opaque. If we identify a problem, what happens? In the case of detecting that we are speeding, most of us will slow down. If the police detect you are speeding, they may stop you or (more likely) issue you a fine and eventually you’ll use up your licence and have to stop driving. We just give people low marks or fail them. But, combine this with mechanism issues, and suddenly we need to ask if we’re even ready to try to take action if we had the analytics.
Let’s say we get all the data and it’s reliable and pedagogically sensible. We work out how to link things together. We build community support and we focus it correctly. You run analytics over your data. After some digging, you discover that 70% of your teaching staff simply don’t know how to do their jobs. And, as far as you can see, have been performing at this standard for 20 years.
What do you do?
Until we are ready to listen to what analytics tell us, until we have had the discussion of how we deal with students (and staff) who may wish to opt out, and until we have looked at this as the monstrous, resource-hungry, incredibly complex problem that it is, we really have to ask if we’re ready to take learning analytics seriously. And, given how much money can be spent on this, it’s probably better to work out if we’re going to listen before we invest money into a solution that won’t work because it cannot work.
Data: Harder to Anonymise Yourself Than You Might Think
Posted: October 18, 2014 Filed under: Education, Opinion | Tags: Black Static, blogging, community, curriculum, data, data visualisation, education, feedback, higher education, Interzone, measurement, reflection, submission, submission system, teaching, teaching approaches, thinking, universal principles of design Leave a commentThere’s a lot of discussion around a government’s use of metadata at the moment, where instead of looking at the details of your personal data, government surveillance is limited to looking at the data associated with your personal data. In the world of phone calls, instead of taping the actual call, they can see the number you dialled, the call time and its duration, for example. CBS have done a fairly high-level (weekend-suitable) coverage of a Stanford study that quickly revealed a lot more about participants than they would have thought possible from just phone numbers and call times.
But how much can you tell about a person or an organisation without knowing the details? I’d like to show you a brief, but interesting, example. I write fiction and I’ve recently signed up to “The Submission Grinder“, which allows you to track your own submissions and, by crowdsourcing everyone’s success and failures, to also track how certain markets are performing in terms of acceptance, rejection and overall timeliness.
Now, I have access to no-one else’s data but my own (which is all of 5 data points) but I’ll show you how assembling these anonymous data results together allows me to have a fairly good stab at determining organisational structure and, in one case, a serious organisational transformation.
Let’s start by looking at a fairly quick turnover semi-pro magazine, Black Static. It’s a short fiction market with horror theming. Here’s their crowd-sourced submission graph for response times, where rejections are red and acceptances are green. (Sorry, Damien.)
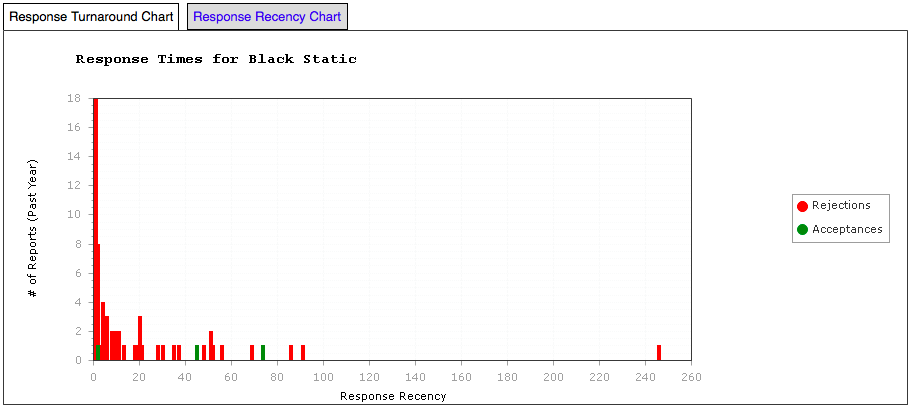
Black Static – Response Time Graph
Black Static has a web submission system and, as you can see, most rejections happen in the first 2-3 weeks. There is then a period where further work goes on. (It’s very important to note that this is a sample generated by those people who are using Submission Grinder, which is a subset of all people submitting to Black Static.) What this looks like, given that it is unlikely that anyone could read a lot 4,000-7,000 manuscripts in detail at a time, is that the editor is skimming the electronic slush pile to determine if it’s worth going to other readers. After this initial 2 week culling, what we are seeing is the result of further reading so we’d probably guess that the readers’ reviews are being handled as they come in, with some indication that this is one roughly weekly – maybe as a weekend job? It’s hard to say because there’s not much data beyond 21 days so we’re guessing.
Let’s look at Black Static’s sister SF magazine, Interzone, now semi-pro but still very highly regarded.

Interzone – Response Time Graph
Lots more data here! Again, there appears to be a fairly fast initial cut-off mechanism from skimming the web submission slush pile. (And I can back this up with actual data as Interzone rejected one of my stories in 24 hours.) Then there appears to be a two week period where some thinking or reading takes place and then there’s a second round of culling, which may be an editorial meeting or a fast reader assignment. Finally we see two more fortnightly culls as the readers bring back their reviews. I think there’s enough data here to indicate that Interzone’s editorial group consider materials most often every fortnight. Also the acceptances generated by positive reviews appear to be the same quantity as those from the editors – although there’s so little data here we’re really grabbing at tempting looking straws.
Now let’s look at two pro markets, starting with the Magazine of Fantasy & Science Fiction.
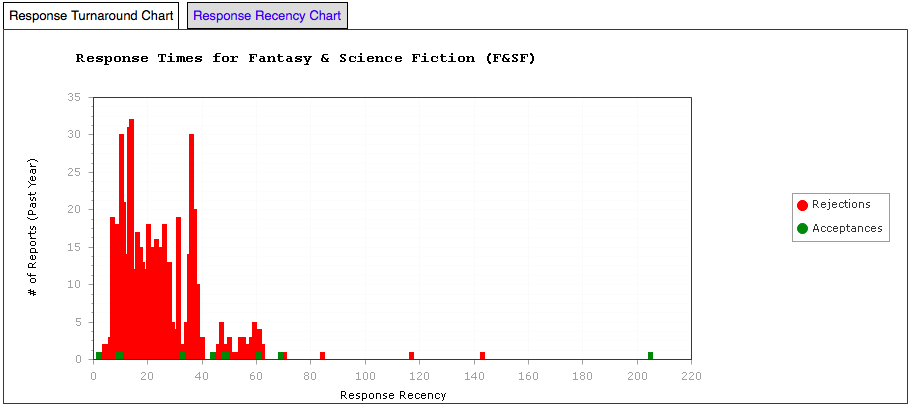
Fantasy & Science Fiction – Response Time Graph
This doesn’t have the same initial culling process that the other two had, although it appears that there is a period of 7-14 days when a lot of work has been reviewed and then rejected – we don’t see as much work rejected again until the 35 day mark, when it looks like all reader reviews are back. Notably, there is a large gap between the initial bunch of acceptances (editor says ‘yes’) and then acceptances supported by reviewers. I’m speculating now but I wonder if what we’re seeing between that first and second group of acceptances are reviewers who write back in and say “Don’t bother” quickly, rather than assembling personalised feedback for something that could be salvaged. Either way, the message here is simple. If you survive the first four weeks in F&SF system, then you are much less likely to be rejected and, with any luck, this may translate (worse case) into personal suggestions for improvement.
F&SF has a postal submission system, which makes it far more likely that the underlying work is going to batched in some way, as responses have to go out via mail and doing this in a more organised fashion makes sense. This may explain why this is such a high level of response overall for the first 35 days, as you can’t easily click a button to send a response electronically and there’re a finite number of envelopes any one person wants to prepare on any given day. (I have no idea how right I am but this is what I’m limited to by only observing the metadata.)
Tor.com has a very interesting graph, which I’ll show below.
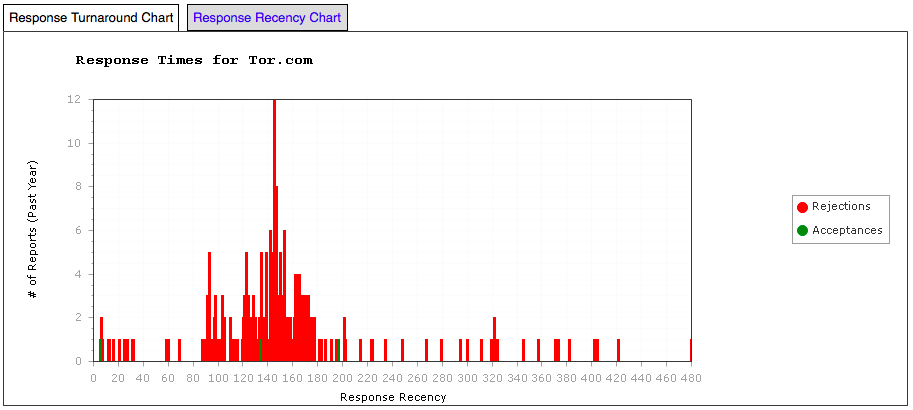
Tor.com – Response Time Graph
Tor.com pays very well and has an on-line submission system via e-mail. As a result, it is positively besieged with responses and their editorial team recently shut down new submissions for two months while they cleared backlog. What interested me in this data was the fact that the 150 day spike was roughly twice as high as the 90 and 120. Hmm – 90, 120, 150 as dominant spikes. Does that sound like a monthly editors’ meeting to anyone else? By looking at the recency graph (which shows activity relative to today) we can see that there has been an amazing flurry of activity at Tor.com in the past month. Tor.com has a five person editorial team (from their website) with reading and support from two people (plus occasional others). It’s hard for five people to reach consensus without discussion so that monthly cycle looks about right. But it will take time for 7 people to read all of that workload, which explains the relative silence until 3 months have elapsed.
What about that spike at 150? It could be the end of the initial decisions and the start of “worth another look” pile so let’s see if their web page sheds any light on it. Aha!
Have you read my story? We reply to everything we’ve finished evaluating, so if you haven’t heard from us, the answer is “probably not.” At this point the vast majority of stories greater than four months old are in our second-look pile, and we respond to almost everything within seven months.
I also wonder if we are seeing previous data where it was taking longer to get decisions made – whether we are seeing two different time management strategies of Tor.com at the same time, being the 90+120 version as well as the 150 version. Looking at the website again.
Response times have improved quite a bit with the expansion of our first reader team (emphasis mine), and we now respond to the vast majority of stories within three months. But all of the stories they like must then be read by the senior editorial staff, who are all full-time editors with a lot on our plates.
So, yes, the size of Tor.com’s slush pile and the number of editors that must agree basically mean that people are putting time aside to make these decisions, now aiming at 90 days, with a bit of spillover. It looks like we are seeing two regimes at once.
All of this information is completely anonymous in terms of the stories, the authors and any actual submission or acceptance patterns that could relate data together. But, by looking at this metadata on the actual submissions, we can now start to get an understanding of the internal operations of an organisation, which in some cases we can then verify with publicly held information.
Now think about all the people you’ve phoned, the length of time that you called them and what could be inferred about your personal organisation from those facts alone. Have a good night’s sleep!
