
Designing a MOOC: how far did it reach? #csed
Posted: June 10, 2015 Filed under: Education, Opinion | Tags: advocacy, authenticity, blogging, collaboration, community, computer science education, constructivist, contributing student pedagogy, curriculum, data visualisation, design, education, educational problem, educational research, ethics, feedback, higher education, in the student's head, learning, measurement, MOOC, moocs, principles of design, reflection, resources, students, teaching, teaching approaches, thinking, tools Leave a commentMark Guzdial posted over on his blog on “Moving Beyond MOOCS: Could we move to understanding learning and teaching?” and discusses aspects (that still linger) of MOOC hype. (I’ve spoken about MOOCs done badly before, as well as recording the thoughts of people like Hugh Davis from Southampton.) One of Mark’s paragraphs reads:
“The value of being in the front row of a class is that you talk with the teacher. Getting physically closer to the lecturer doesn’t improve learning. Engagement improves learning. A MOOC puts everyone at the back of the class, listening only and doing the homework”
My reply to this was:
“You can probably guess that I have two responses here, the first is that the front row is not available to many in the real world in the first place, with the second being that, for far too many people, any seat in the classroom is better than none.
But I am involved in a, for us, large MOOC so my responses have to be regarded in that light. Thanks for the post!”
Mark, of course, called my bluff and responded with:
“Nick, I know that you know the literature in this space, and care about design and assessment. Can you say something about how you designed your MOOC to reach those who would not otherwise get access to formal educational opportunities? And since your MOOC has started, do you know yet if you achieved that goal — are you reaching people who would not otherwise get access?”
So here is that response. Thanks for the nudge, Mark! The answer is a bit long but please bear with me. We will be posting a longer summary after the course is completed, in a month or so. Consider this the unedited taster. I’m putting this here, early, prior to the detailed statistical work, so you can see where we are. All the numbers below are fresh off the system, to drive discussion and answering Mark’s question at, pretty much, a conceptual level.
First up, as some background for everyone, the MOOC team I’m working with is the University of Adelaide‘s Computer Science Education Research group, led by A/Prof Katrina Falkner, with me (Dr Nick Falkner), Dr Rebecca Vivian, and Dr Claudia Szabo.
I’ll start by noting that we’ve been working to solve the inherent scaling issues in the front of the classroom for some time. If I had a class of 12 then there’s no problem in engaging with everyone but I keep finding myself in rooms of 100+, which forces some people to sit away from me and also limits the number of meaningful interactions I can make to individuals in one setting. While I take Mark’s point about the front of the classroom, and the associated research is pretty solid on this, we encountered an inherent problem when we identified that students were better off down the front… and yet we kept teaching to rooms with more student than front. I’ll go out on a limb and say that this is actually a moral issue that we, as a sector, have had to look at and ignore in the face of constrained resources. The nature of large spaces and people, coupled with our inability to hover, means that we can either choose to have a row of students effectively in a semi-circle facing us, or we accept that after a relatively small number of students or number of rows, we have constructed a space that is inherently divided by privilege and will lead to disengagement.
So, Katrina’s and my first foray into this space was dealing with the problem in the physical lecture spaces that we had, with the 100+ classes that we had.
Katrina and I published a paper on “contributing student pedagogy” in Computer Science Education 22 (4), 2012, to identify ways for forming valued small collaboration groups as a way to promote engagement and drive skill development. Ultimately, by reducing the class to a smaller number of clusters and making those clusters pedagogically useful, I can then bring the ‘front of the class’-like experience to every group I speak to. We have given talks and applied sessions on this, including a special session at SIGCSE, because we think it’s a useful technique that reduces the amount of ‘front privilege’ while extending the amount of ‘front benefit’. (Read the paper for actual detail – I am skimping on summary here.)
We then got involved in the support of the national Digital Technologies curriculum for primary and middle school teachers across Australia, after being invited to produce a support MOOC (really a SPOC, small, private, on-line course) by Google. The target learners were teachers who were about to teach or who were teaching into, initially, Foundation to Year 6 and thus had degrees but potentially no experience in this area. (I’ve written about this before and you can find more detail on this here, where I also thanked my previous teachers!)
The motivation of this group of learners was different from a traditional MOOC because (a) everyone had both a degree and probable employment in the sector which reduced opportunistic registration to a large extent and (b) Australian teachers are required to have a certain number of professional development (PD) hours a year. Through a number of discussions across the key groups, we had our course recognised as PD and this meant that doing our course was considered to be valuable although almost all of the teachers we spoke to were furiously keen for this information anyway and my belief is that the PD was very much ‘icing’ rather than ‘cake’. (Thank you again to all of the teachers who have spent time taking our course – we really hope it’s been useful.)
To discuss access and reach, we can measure teachers who’ve taken the course (somewhere in the low thousands) and then estimate the number of students potentially assisted and that’s when it gets a little crazy, because that’s somewhere around 30-40,000.
In his talk at CSEDU 2014, Hugh Davis identified the student groups who get involved in MOOCs as follows. The majority of people undertaking MOOCs were life-long learners (older, degreed, M/F 50/50), people seeking skills via PD, and those with poor access to Higher Ed. There is also a small group who are Uni ‘tasters’ but very, very small. (I think we can agree that tasting a MOOC is not tasting a campus-based Uni experience. Less ivy, for starters.) The three approaches to the course once inside were auditing, completing and sampling, and it’s this final one that I want to emphasise because this brings us to one of the differences of MOOCs. We are not in control of when people decide that they are satisfied with the free education that they are accessing, unlike our strong gatekeeping on traditional courses.
I am in total agreement that a MOOC is not the same as a classroom but, also, that it is not the same as a traditional course, where we define how the student will achieve their goals and how they will know when they have completed. MOOCs function far more like many people’s experience of web browsing: they hunt for what they want and stop when they have it, thus the sampling engagement pattern above.
(As an aside, does this mean that a course that is perceived as ‘all back of class’ will rapidly be abandoned because it is distasteful? This makes the student-consumer a much more powerful player in their own educational market and is potentially worth remembering.)
Knowing these different approaches, we designed the individual subjects and overall program so that it was very much up to the participant how much they chose to take and individual modules were designed to be relatively self-contained, while fitting into a well-designed overall flow that built in terms of complexity and towards more abstract concepts. Thus, we supported auditing, completing and sampling, whereas our usual face-to-face (f2f) courses only support the first two in a way that we can measure.
As Hugh notes, and we agree through growing experience, marking/progress measures at scale are very difficult, especially when automated marking is not enough or not feasible. Based on our earlier work in contributing collaboration in the class room, for the F-6 Teacher MOOC we used a strong peer-assessment model where contributions and discussions were heavily linked. Because of the nature of the cohort, geographical and year-level groups formed who then conducted additional sessions and produced shared material at a slightly terrifying rate. We took the approach that we were not telling teachers how to teach but we were helping them to develop and share materials that would assist in their teaching. This reduced potential divisions and allows us to establish a mutually respectful relationship that facilitated openness.
(It’s worth noting that the courseware is creative commons, open and free. There are people reassembling the course for their specific take on the school system as we speak. We have a national curriculum but a state-focused approach to education, with public and many independent systems. Nobody makes any money out of providing this course to teachers and the material will always be free. Thank you again to Google for their ongoing support and funding!)
Overall, in this first F-6 MOOC, we had higher than usual retention of students and higher than usual participation, for the reasons I’ve outlined above. But this material was for curriculum support for teachers of young students, all of whom were pre-programming, and it could be contained in videos and on-line sharing of materials and discussion. We were also in the MOOC sweet-spot: existing degreed learners, PD driver, and their PD requirement depended on progressive demonstration on goal achievement, which we recognised post-course with a pre-approved certificate form. (Important note: if you are doing this, clear up how the PD requirements are met and how they need to be reported back, as early on as you can. It meant that we could give people something valuable in a short time.)
The programming MOOC, Think. Create. Code on EdX, was more challenging in many regards. We knew we were in a more difficult space and would be more in what I shall refer to as ‘the land of the average MOOC consumer’. No strong focus, no PD driver, no geographically guaranteed communities. We had to think carefully about what we considered to be useful interaction with the course material. What counted as success?
To start with, we took an image-based approach (I don’t think I need to provide supporting arguments for media-driven computing!) where students would produce images and, over time, refine their coding skills to produce and understand how to produce more complex images, building towards animation. People who have not had good access to education may not understand why we would use programming in more complex systems but our goal was to make images and that is a fairly universally understood idea, with a short production timeline and very clear indication of achievement: “Does it look like a face yet?”
In terms of useful interaction, if someone wrote a single program that drew a face, for the first time – then that’s valuable. If someone looked at someone else’s code and spotted a bug (however we wish to frame this), then that’s valuable. I think that someone writing a single line of correct code, where they understand everything that they write, is something that we can all consider to be valuable. Will it get you a degree? No. Will it be useful to you in later life? Well… maybe? (I would say ‘yes’ but that is a fervent hope rather than a fact.)
So our design brief was that it should be very easy to get into programming immediately, with an active and engaged approach, and that we have the same “mostly self-contained week” approach, with lots of good peer interaction and mutual evaluation to identify areas that needed work to allow us to build our knowledge together. (You know I may as well have ‘social constructivist’ tattooed on my head so this is strongly in keeping with my principles.) We wrote all of the materials from scratch, based on a 6-week program that we debated for some time. Materials consisted of short videos, additional material as short notes, participatory activities, quizzes and (we planned for) peer assessment (more on that later). You didn’t have to have been exposed to “the lecture” or even the advanced classroom to take the course. Any exposure to short videos or a web browser would be enough familiarity to go on with.
Our goal was to encourage as much engagement as possible, taking into account the fact that any number of students over 1,000 would be very hard to support individually, even with the 5-6 staff we had to help out. But we wanted students to be able to develop quickly, share quickly and, ultimately, comment back on each other’s work quickly. From a cognitive load perspective, it was crucial to keep the number of things that weren’t relevant to the task to a minimum, as we couldn’t assume any prior familiarity. This meant no installers, no linking, no loaders, no shenanigans. Write program, press play, get picture, share to gallery, winning.
As part of this, our support team (thanks, Jill!) developed a browser-based environment for Processing.js that integrated with a course gallery. Students could save their own work easily and share it trivially. Our early indications show that a lot of students jumped in and tried to do something straight away. (Processing is really good for getting something up, fast, as we know.) We spent a lot of time testing browsers, testing software, and writing code. All of the recorded materials used that development environment (this was important as Processing.js and Processing have some differences) and all of our videos show the environment in action. Again, as little extra cognitive load as possible – no implicit requirement for abstraction or skills transfer. (The AdelaideX team worked so hard to get us over the line – I think we may have eaten some of their brains to save those of our students. Thank you again to the University for selecting us and to Katy and the amazing team.)
The actual student group, about 20,000 people over 176 countries, did not have the “built-in” motivation of the previous group although they would all have their own levels of motivation. We used ‘meet and greet’ activities to drive some group formation (which worked to a degree) and we also had a very high level of staff monitoring of key question areas (which was noted by participants as being very high for EdX courses they’d taken), everyone putting in 30-60 minutes a day on rotation. But, as noted before, the biggest trick to getting everyone engaged at the large scale is to get everyone into groups where they have someone to talk to. This was supposed to be provided by a peer evaluation system that was initially part of the assessment package.
Sadly, the peer assessment system didn’t work as we wanted it to and we were worried that it would form a disincentive, rather than a supporting community, so we switched to a forum-based discussion of the works on the EdX discussion forum. At this point, a lack of integration between our own UoA programming system and gallery and the EdX discussion system allowed too much distance – the close binding we had in the R-6 MOOC wasn’t there. We’re still working on this because everything we know and all evidence we’ve collected before tells us that this is a vital part of the puzzle.
In terms of visible output, the amount of novel and amazing art work that has been generated has blown us all away. The degree of difference is huge: armed with approximately 5 statements, the number of different pieces you can produce is surprisingly large. Add in control statements and reputation? BOOM. Every student can write something that speaks to her or him and show it to other people, encouraging creativity and facilitating engagement.
From the stats side, I don’t have access to the raw stats, so it’s hard for me to give you a statistically sound answer as to who we have or have not reached. This is one of the things with working with a pre-existing platform and, yes, it bugs me a little because I can’t plot this against that unless someone has built it into the platform. But I think I can tell you some things.
I can tell you that roughly 2,000 students attempted quiz problems in the first week of the course and that over 4,000 watched a video in the first week – no real surprises, registrations are an indicator of interest, not a commitment. During that time, 7,000 students were active in the course in some way – including just writing code, discussing it and having fun in the gallery environment. (As it happens, we appear to be plateauing at about 3,000 active students but time will tell. We have a lot of post-course analysis to do.)
It’s a mistake to focus on the “drop” rates because the MOOC model is different. We have no idea if the people who left got what they wanted or not, or why they didn’t do anything. We may never know but we’ll dig into that later.
I can also tell you that only 57% of the students currently enrolled have declared themselves explicitly to be male and that is the most likely indicator that we are reaching students who might not usually be in a programming course, because that 43% of others, of whom 33% have self-identified as women, is far higher than we ever see in classes locally. If you want evidence of reach then it begins here, as part of the provision of an environment that is, apparently, more welcoming to ‘non-men’.
We have had a number of student comments that reflect positive reach and, while these are not statistically significant, I think that this also gives you support for the idea of additional reach. Students have been asking how they can save their code beyond the course and this is a good indicator: ownership and a desire to preserve something valuable.
For student comments, however, this is my favourite.
I’m no artist. I’m no computer programmer. But with this class, I see I can be both. #processingjs (Link to student’s work) #code101x .
That’s someone for whom this course had them in the right place in the classroom. After all of this is done, we’ll go looking to see how many more we can find.
I know this is long but I hope it answered your questions. We’re looking forward to doing a detailed write-up of everything after the course closes and we can look at everything.
Think. Create. Code. Vis! (@edXOnline, @UniofAdelaide, @cserAdelaide, @code101x, #code101x)
Posted: April 30, 2015 Filed under: Education, Opinion | Tags: #code101x, advocacy, blogging, collaboration, community, curriculum, data visualisation, education, educational problem, educational research, edx, higher education, learning, measurement, MOOC, moocs, reflection, resources, teaching, teaching approaches, thinking, tools, universal principles of design Leave a commentI just posted about the massive growth in our new on-line introductory programming course but let’s look at the numbers so we can work out what’s going on and, maybe, what led to that level of success. (Spoilers: central support from EdX helped a huge amount.) So let’s get to the data!
I love visualised data so let’s look at the growth in enrolments over time – this is really simple graphical stuff as we’re spending time getting ready for the course at the moment! We’ve had great support from the EdX team through mail-outs and Twitter and you can see these in the ‘jumps’ in the data that occurred at the beginning, halfway through April and again at the end. Or can you?

Rapid growth in enrolment! But it’s a little hard to see in this data.
Hmm, this is a large number, so it’s not all that easy to see the detail at the end. Let’s zoom in and change the layout of the data over to steps so we can things more easily. (It’s worth noting that I’m using the free R statistical package to do all of this. I can change one line in my R program and regenerate all of my graphs and check my analysis. When you can program, you can really save time on things like this by using tools like R.)

Now you can see where that increase started and then the big jump around the time that e-mail advertising started, circled. That large spike at the end is around 1500 students, which means that we jumped 10% in a day.
When we started looking at this data, we wanted to get a feeling for how many students we might get. This is another common use of analysis – trying to work out what is going to happen based on what has already happened.
As a quick overview, we tried to predict the future based on three different assumptions:
- that the growth from day to day would be roughly the same, which is assuming linear growth.
- that the growth would increase more quickly, with the amount of increase doubling every day (this isn’t the same as the total number of students doubling every day).
- that the growth would increase even more quickly than that, although not as quickly as if the number of students were doubling every day.
If Assumption 1 was correct, then we would expect the graph to look like a straight line, rising diagonally. It’s not. (As it is, this model predicted that we would only get 11,780 students. We crossed that line about 2 weeks ago.
So we know that our model must take into account the faster growth, but those leaps in the data are changes that caused by things outside of our control – EdX sending out a mail message appears to cause a jump that’s roughly 800-1,600 students, and it persists for a couple of days.
Let’s look at what the models predicted. Assumption 2 predicted a final student number around 15,680. Uhh. No. Assumption 3 predicted a final student number around 17,000, with an upper bound of 17,730.
Hmm. Interesting. We’ve just hit 17,571 so it looks like all of our measures need to take into account the “EdX” boost. But, as estimates go, Assumption 3 gave us a workable ballpark and we’ll probably use it again for the next time that we do this.
Now let’s look at demographic data. We now we have 171-172 countries (it varies a little) but how are we going for participation across gender, age and degree status? Giving this information to EdX is totally voluntary but, as long as we take that into account, we make some interesting discoveries.
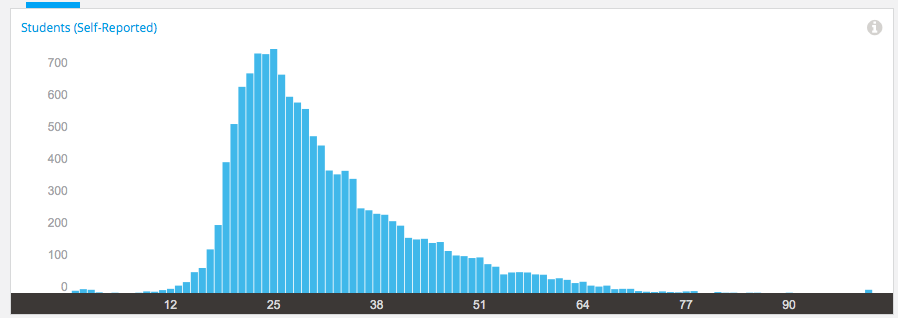
Age demographic data from EdX
Our median student age is 25, with roughly 40% under 25 and roughly 40% from 26 to 40. That means roughly 20% are 41 or over. (It’s not surprising that the graph sits to one side like that. If the left tail was the same size as the right tail, we’d be dealing with people who were -50.)
The gender data is a bit harder to display because we have four categories: male, female, other and not saying. In terms of female representation, we have 34% of students who have defined their gender as female. If we look at the declared male numbers, we see that 58% of students have declared themselves to be male. Taking into account all categories, this means that our female participant percentage could be as high as 40% but is at least 34%. That’s much higher than usual participation rates in face-to-face Computer Science and is really good news in terms of getting programming knowledge out there.
We’re currently analysing our growth by all of these groupings to work out which approach is the best for which group. Do people prefer Twitter, mail-out, community linkage or what when it comes to getting them into the course.
Anyway, lots more to think about and many more posts to come. But we’re on and going. Come and join us!
Think. Create. Code. Wow! (@edXOnline, @UniofAdelaide, @cserAdelaide, @code101x, #code101x)
Posted: April 30, 2015 Filed under: Education, Opinion | Tags: #code101x, advocacy, authenticity, blogging, community, cser digital technologies, curriculum, digital technologies, education, educational problem, educational research, ethics, higher education, Hugh Davis, learning, MOOC, moocs, on-line learning, research, Southampton, student perspective, teaching, teaching approaches, thinking, tools, University of Southampton 1 Comment
Screenshot of our EdX page. Shiny!
Things are really exciting here because, after the success of our F-6 on-line course to support teachers for digital technologies, the Computer Science Education Research group are launching their first massive open on-line course (MOOC) through AdelaideX, the partnership between the University of Adelaide and EdX. (We’re also about to launch our new 7-8 course for teachers – watch this space!)
Our EdX course is called “Think. Create. Code.” and it’s open right now for Week 0, although the first week of real content doesn’t go live until the 30th. If you’re not already connected with us, you can also follow us on Facebook (code101x) or Twitter (@code101x), or search for the hashtag #code101x. (Yes, we like to be consistent.)
I am slightly stunned to report that, less than 24 hours before the first content starts to roll out, that we have 17,531 students enrolled, across 172 countries. Not only that, but when we look at gender breakdown, we have somewhere between 34-42% women (not everyone chooses to declare a gender). For an area that struggles with female participation, this is great news.
I’ll save the visualisation data for another post, so let’s quickly talk about the MOOC itself. We’re taking a 6 week approach, where students focus on developing artwork and animation using the Processing language, but it requires no prior knowledge and runs inside a browser. The interface that has been developed by the local Adelaide team (thank you for all of your hard work!) is outstanding and it’s really easy to make things happen.
I love this! One of the biggest obstacles to coding is having to wait until you see what happens and this can lead to frustration and bad habits. In Processing you can have a circle on the screen in a matter of seconds and you can start playing with colour in the next second. There’s a lot going on behind the screen to make it this easy but the student doesn’t need to know it and can get down to learning. Excellent!
I went to a great talk at CSEDU last year, presented by Hugh Davis from Southampton, where Hugh raised some great issues about how MOOCs compared to traditional approaches. I’m pleased to say that our demography is far more widespread than what was reported there. Although the US dominates, we have large representations from India, Asia, Europe and South America, with a lot of interest from Africa. We do have a lot of students with prior degrees but we also have a lot of students who are at school or who aren’t at University yet. It looks like the demography of our programming course is much closer to the democratic promise of free on-line education but we’ll have to see how that all translates into participation and future study.
While this is an amazing start, the whole team is thinking of this as part of a project that will be going on for years, if not decades.
When it came to our teaching approach, we spent a lot of time talking (and learning from other people and our previous attempts) about the pedagogy of this course: what was our methodology going to be, how would we implement this and how would we make it the best fit for this approach? Hugh raised questions about the requirement for pedagogical innovation and we think we’ve addressed this here through careful customisation and construction (we are working within a well-defined platform so that has a great deal of influence and assistance).
We’ve already got support roles allocated to staff and students will see us on the course, in the forums, and helping out. One of the reasons that we tried to look into the future for student numbers was to work out how we would support students at this scale!
One of our most important things to remember is that completion may not mean anything in the on-line format. Someone comes on and gets an answer to the most pressing question that is holding them back from coding, but in the first week? That’s great. That’s success! How we measure that, and turn that into traditional numbers that match what we do in face-to-face, is going to be something we deal with as we get more information.
The whole team is raring to go and the launch point is so close. We’re looking forward to working with thousands of students, all over the world, for the next six weeks.
Sound interesting? Come and join us!
Humanities Intensive Learning + Teaching, Day 5, Maryland Institute for Technology in the Humanities, #hilt2014
Posted: August 17, 2014 Filed under: Education | Tags: clowns, cMOOC, data visualisation, Elijah Meeks, Francis Bacon, Franco Moretti, Gephi, Google, graphs, Hamlet, Hamlet Hamlet Hamlet, HILT, HILT 2014, HITS, Horatio, map, Medicis, MITH, monkey, MOOC, Moretti, network, network visualisation, PageRank, RDF, Shakespeare, Small worlds, Tufte, visualisation, xMOOC, Zelchenko 1 CommentSorry for the delay in completing this – it has been crazy and I prefer to write directly into the live blog, which means a network feed, as I just find it easier to put things together this way. (It’s only been a week (ish) anyway.)
Today (well, then), we looked at modularity and how we could break networks into separate communities. This is important because it helps us to be able to see structure. The human eye is a great tool but it often needs help and modularity is a good way to do this. We have strong ties between components in directed networks (unidirectional) because we have taken the time to say that the link goes this way. We have weak ties in undirected networks because there is no solidity to the association form one side to the other. The more connected something is, the more strongly tied it is to the things it connects to so, when we hunt for communities, we want to take away the least number of connections to produce the largest number of connected communities.
Let’s look at the Hamlet graph (after Moretti) with some colouring added for the various communities and all the connections left in.

It’s hard to see any separation here although the communities can be seen.
Now let’s take out the intra-community links.

Bingo! Poor old Hamlet.
Now we can suddenly see, in terms of dialogue exchanges and interaction, how isolated Hamlet actually is. The members of the court are one community. The invaders are another. Horatio, the proxy for the Danish state, is deeply involved in statehood. Hamlet, however, is more heavily connected to the characters who help with his dawning realisation that something has gone awry. No wonder he goes mad, he’s the Nigel Nofriends of Medieval Denmark, with only the insane Clown Posse and a group of second-rate actors to keep him company.
After this we spent some extensive time working on producing prettier looking graphs with Gephi and using more advanced algorithms to help us to represent what’s going on. We looked at the Twitter data for the conference and came up with this:

Twitter data using the #HILT2014 tag
This shows the separate groups of Twitter user communities who used the HILT2014 hashtag. My small cluster is the small purple arrow bottomish left. We’ve also ranked the size of the data labels based on the significance of that person in the Twitter information chain, using the PageRank algorithm. So, Jim McGrath wins Twitter for HILT 2014! We also look and how important certain links were in the network by looking at edge betweenness to determine which links are used by the most shortest paths and then use this to identify important connected components.
Lots of good hands-on stuff and a very interesting course! I learned a great deal and have already started using it elsewhere.
Humanities Intensive Learning + Teaching, Day 4, Maryland Institute for Technology in the Humanities, #hilt2014
Posted: August 8, 2014 Filed under: Education | Tags: clowns, cMOOC, data visualisation, Elijah Meeks, Francis Bacon, Franco Moretti, Gephi, Google, graphs, Hamlet, Hamlet Hamlet Hamlet, HILT, HILT 2014, HITS, Horatio, map, Medicis, MITH, monkey, MOOC, Moretti, network, network visualisation, PageRank, RDF, Shakespeare, Small worlds, Tufte, visualisation, xMOOC, Zelchenko Leave a commentOr, the alternative title, “The Play Formerly Known as Hamlet”. Today had a lot of fascination discussion where the bipartite nature of our class network became apparent, in terms of the the majority of the class who were Digital Humanists and really understood a detailed close reading of Hamlet – and your humble narrator.
Today we talked about modularity, which allows you to break your network up into separate modules, which makes a lot more sense when you call those modules things like communities, groups or clusters. Can your network be split up into areas where some groups are more connected to each other than they are to adjacent nodes? By doing this, we are trying to expose structural features of the network and, in particular, unexpected aspects of network structure – is there some set of nodes that have a role in the network that we don’t understand? If we talk about this in terms of people, if our social network is made up of small communities with connections between the communities, then we would expect gossip to spread more rapidly inside a community than between the communities. Simple, eh? The approach we take depends upon comparing the structure we have with a model of a random network using the same number of links.
Once we’ve done this, we can use this in a tool, such as Gephi, to clearly illustrate the groups. Here’s a grumpy Dane in illustration.

Hamlet and the various posses of Hamlet. Note the Insane Clown Posse.
I’ve coloured and tagged the network to show the key players in Hamlet, based on Moretti’s analysis of Hamlet, which attached unweighted connections between participants who had direct conversations. Now, we’ve made the size of the nodes reflect how relatively important (in terms of betweenness, the number of paths that must go through this person). If we did this in terms of PageRank, another measure of the relative importance of nodes, based on their connectivity, the nodes in green would jump up in size. But what you should note is that Hamlet and Horatio are roughly the same size and, while Hamlet is much more connected to everyone (quelle surprise, given the play’s named after him), the only thing that we lose if Hamlet disappears is that we no longer can hear from the Insane Clown Posse, Lucianus and the Lord. In purely connected terms he doesn’t appear to be that important. We’d obviously lose a lot of the text if he disappeared but how important is Hamlet in Hamlet?
This led to a lot of discussion in class as to the validity of the original Moretti pamphlet, much of which is core to the entire discussion of Digital Humanities. How valid is any conclusion from a network model such as this when the innate nature of the capture process (to provide the capta) may completely remove the ability to draw certain conclusions? The class discussed the impact on perceived and invisible observers, who strictly don’t have dialogue with each other but potentially have an impact upon other characters and their narrative interactions. (The Moretti pamphlet may be found here.) Moretti had a lot to say about Horatio as a proxy for the state and was very interested in the closeness of Hamlet to everyone else, but (later on) we ran some random network experiments and it turned out to be the type of connections in the network (the clustering coefficient) that was more interesting than the closeness.
We then moved on to a discussion of a number of useful metric for networks, including the clustering effects that tend to indicate intention in the system we’re studying (there’s no real reason for a random network to form a small number of unique clusters unless you tune for it.) We also discussed the Small Worlds of Watts and Strogatz (1998) where you have cliques of nodes (tightly connected clusters) linked together by a smaller number of links, characterised by a power law distribution and a higher clustering coefficient (very basically).
We generated some random graphs to see if we got the structure we saw in Hamlet as noted earlier. Why? Because looking at Hamlet and drawing out information from the structure only has validity if (1) the model is accurate and (2) the situation couldn’t have easily arisen by chance. As noted, we generated a random graph for the same number of nodes and it had a similar average path length and identical diameter – but very different clustering coefficients! So it turns out that Hamlet wasn’t written by a monkey after all.

Don’t laugh, this is Darwin’s skull!
The final part of the session was on dynamic networks. This is the study of networks that change over time and we worked with some data that showed people’s association with an area over time. We could look at this in terms of change in time or in terms of progress through a corpus (chapters are as useful as dates here). What you want is a start date and an end date for the feautres in your network – when should the feature be there and when should it not be there anymore? It turns out that Gephi is quite convenient here, because you can merge a start and end time and end up with a time interval. Not bad, Gephi, not bad. Now we can see when things are active – great if you’re looking to see when students are active in forums or activities, for example. Here’s an example of the difference in the test network between the first and second halves of 2009, with all nodes of zero degree (nodes with no links) removed.

First half of 2009

Second half of 2009
We then played around a lot with a vide variety of animations over time, including ongoing calculations, colour and shape alterations. Basically, it was rather hallucinatory by the end but that may be the Dr Pepper talking. We even got to see the sparklines (Zelchenko/Tufte) for some extra visualisation goodness!
This is one of those classic separations between the things we visualise for ourselves to help us to work out what’s interesting about a dataset and what we would visualise for presentation, especially to non-discipline people. There’s a really big difference between what scientists want to see and what other people want to see – and if we don’t realise that, then we risk either having presentations that don’t communicate enough information or we kill people with minutiae. Look at this – how useful is it for you?

Death by Sparkline!
Another good day but I think there are some very full brains!
Humanities Intensive Learning + Teaching, Day 3, Maryland Institute for Technology in the Humanities, #hilt2014
Posted: August 8, 2014 Filed under: Education | Tags: capta, cMOOC, data visualisation, Elijah Meeks, Florence, Google, graphs, HILT, HILT 2014, HITS, map, Medicis, MITH, MOOC, network, network visualisation, PageRank, RDF, visualisation, xMOOC Leave a commentToday was going to be a short day because we had the afternoon off to go and do cultural things. (I took the afternoon to write papers and catch up on work. I tend to work in both timezones when travelling because otherwise work will eat my head.) Today we explored a lot of filtering in Gephi, which was … interesting and best done in practice. Which we did. So, hooray!
We looked at Multimodal Network Projection throughout the day but I’ll come back to that. We started looking at other ways of determining the important and dependant nodes in a network, starting with the HITS algorithm, which identifies Hubs and Authorities in your network.
Then we moved into the wonderful world of PageRank, Citation networks and how all of these things work. PageRank is, fundamentally, how Google works out which pages to give you. You won’t be able to find out the details of the way that Google runs PageRank because gaming PageRank to serve up pages that you probably didn’t want to see is very big business and highly irritating. Search Engine Optimisers (SEOs) spend a lot of time trying to reverse engineer the algorithm and Google spends a lot of time tweaking it. It’s good we’ve solved all the important problems in the world so we can spend time on this.
Back to PageRank. PageRank looks at the number of links going to a node and what the quality of these links is in order to work out which the most important nodes (pages in the case of Google search) are and, hence, which ones you want. In Digital Humanities, you can use this to identify the most significant element of your model – which, by the way, quickly establishes that Hamlet is not as important as you think. Take that, Hamlet! Want more detail on PageRank? Look here.

From Wikipedia: The more you are pointed to by quality links, the bigger (and happier) you are. Hooray!
In Citations, we want to see how is citing which reference, which is straightforward. In Co-Citation networks, we want to measure how often two documents are cited together. There are many reasons for looking at this, but it helps to detect things like cronyism (someone citing a paper because they like someone rather than because the information is useful). As we discussed before, the Matthew Effect comes in quickly, where frequently cited papers get even more frequently cited because they must be good because they’re cited so frequently. (Tadahhh.)
We also looked at a rather complicated area of multimodal projection, which is going to need some set-up. If you have a set of authors and a set of publications, then you can associate authors with publications and vice versa. However, this means that the only way for two authors to be connected is by sharing a publication and similarly for two publications sharing an author. This is a bipartite network and is very common in this kind of modelling. Now, if we make it more complicated, by moving to a conference and having Authors, Papers and Presentation Sessions, we now have a tripartite network and this becomes very hard to visualise.
What we can do is clean up this network to make it easier to represent by hiding some of the complexity in the connections between nodes. Let’s say we want to look at Authors and Presentation Sessions. Then, while the real network is Authors connected to Papers connected to Presentation Sessions, we can hide the Papers with a network link that effectively says “connects this author via a presentation to this session” and suddenly our network looks like it’s only Authors and Sessions. This level of visual de-cluttering, which is dimensional reduction for those playing along at home, makes it easier for us to visually represent the key information and produce network statistics on these simpler graphs. It’s also a natural fit for triple-based representations like the Resource Description Framework (RDF) because the links in the network now map straight to predicates. (Don’t worry if you didn’t get that last bit, some people just got very excited.)
Finally, we looked at how we collect information. Is it stuff we just pick up from the environment (data) or is it something that we choose the way that we collect it (capta)? (Capta comes from the word for capture. Data is passive. Capta is active. Take that, Bembridge Scholars!) If you think about it, every time you put your data into a spreadsheet, you are imposing a structure upon it, even down to which column is which – it’s not technically data, it’s capta because your interpretation alters it before it even reaches the analysis stage. When it comes to the network that you draw, do you care about the Proximities of elements in your network (location, membership or attitude), the Relations in your network (role, affective, perceptual), the Interactions or the Flows? All of these are going to change what the nodes and edges (links) represent in the network.
The simple rule is that entities are connected by relationships (For those who think in tuples, think “subject, predicate, object” and get your predicate on!) However you do it, you have to pick what’s important in your data, find it, capture it, analyse it and present it in a way that either shows you cool things or supports the cool things that you already know.
A lot to cover today!
After the session, I did some work and then headed off for dinner and board games with some of the other people from the workshop. A nice relaxing night after a rather intense three days.
Humanities Intensive Learning + Teaching, Day 2, Maryland Institute for Technology in the Humanities, #hilt2014
Posted: August 8, 2014 Filed under: Education | Tags: betweenness, centrality, cMOOC, data visualisation, Elijah Meeks, Florence, graphs, HILT, HILT 2014, Medicis, MITH, MOOC, network, network measurements, network visualisation, visualisation, xMOOC Leave a commentIn Day 2, we looked at using the Gephi tool itself, along with the nature of how networks are tied together, looking at network degree and how we could calculate paths through the network. It’s probably important to talk about some of the key concepts of how we measure connectedness in a network, and the relevant importance of nodes.
The degree of a node is the number of links that connect to it. If we care about whether the links have some idea of direction associated with them then we might split this into in-degree and out-degree, being the number of links going in and the number of links going out. What do we mean by direction? Consider Facebook. If you and I are going to be Friends then we both have to agree to be Friends – I can’t be a friend unless you want to a friend to. This is an undirected arrangement and a connection between us implies that both us have an equal connection to each other. Now think about unrequited love: Duckie loves Andie but Andie loves Blane. In this case, the love is directed. Just because Duckie loves Andie, it doesn’t mean that Andie loves Duckie.

Time to put on some Psychedelic Furs and find the alternate ending. (Yeah, yeah, it’s not actually in the story and it’s creepy.)
ALTHOUGH IT SHOULD, JOHN HUGHES!!!
(An amusing aside for network/maths people is that, sadly, love is not transitive or “Pretty in Pink” would have been way ahead of its time.)
One of the other things that we care about in networks is the relative importance of nodes in terms of how many other nodes they are connected to and what this means in terms of the paths we take through the network. When we talk about paths, we usually mean the shortest path, where we start somewhere and go through the minimum number of intermediate points until we get to the destination. We don’t run around in circles. We don’t go one way and then go another. This is important because the paths through a network can quickly identify the important nodes and, therefore, the links between them that are the most travelled thoroughfares.
In this world, we start to worry about the centrality of a node, which indicates how important it is by looking at how many other nodes it is connected to or how many other nodes have to use it to get to other places in the network. This means that we have to talk about betweenness, which measures how many times the shortest paths that traverse a network have to go through a node. By calculating the betweenness of every node, for every path, we can work out which of the elements in our network see the most traffic.
In the case of the Medicis, from yesterday, all roads in Florence lead to the Medicis, the family with the highest betweenness rather than the family with the most money or fame. The Medicis are an extreme case because they occupy their position of importance as the only bridge (broker) between certain families.
If a network is made of highly connected elements and all of the betweenness is the same then no-one has an advantage. If your network can be effectively split into two highly connected groups, with a smaller number of high-betweenness elements linking them, then you are seeing a separation that may mean something significant in your particular network domain. From a power perspective, the high betweenness brokers now have the potential to have much more influence if they charge for transit and transform information that traverses them.
One of the things about creating a network from data is that the network we create may not necessarily model reality in a way that answers the questions we’re interested in, but by looking at the network and trying to work out if it’s got some different structure at the macro, meso and micro scale, then that might give us hints as to how to analyse it, to further develop our understanding of the area that we’re modelling with this network.
I’ve written about the difference between the real world and the model before, but let’s just say that “the map is not the territory” and move on. In terms of the structure of networks, while many people assume that the distribution of nodes and links associated with them would end up in some sort of Normal distribution, the truth is that we tend to see a hub-spoke tendency, where there are lots of nodes with few links and fewer nodes with lots of links. When we start to look at the detailed structure rather than the average structure, we can even talk about uniform the structure is. If a network looks the same across itself, such as the same number of connections between nodes, then it’s what we call assortative. If we have small clusters of highly connected nodes joined to other clusters with sparse links, then we’d thinking of it as disassortative. Suddenly, we are moving beyond some overall statistics to look at what we can really say about the structure of a network.
There’s also a phenomenon known as the Matthew Effect, where links and nodes added to a network tend to connect to better connected nodes and, as the network grows, nodes with more connections just get more connected – just like life.
Apart from a lot of Gephi, we finished the day by looking at paths in more detail, which allow us to talk about the network diameter, the size of the largest shortest path in the network. (Remembering that a shortest path contains no loops or false starts, so the largest shortest path shows you the largest number of unique nodes you can visit in the network and gives you an idea of how much time you can waste in that network. 🙂 )
There are some key concepts here, where having redundant paths in a network allows us to survive parts of a network going away (whether computer or social) and having redundant paths of the same quality allows us to endure loss without seeing a significant change in the shortest paths in the network. These are all concepts that we’re familiar with in real life but, once we start to measure them in our network models, we find out the critical components in our data model. If we’re modelling student forums, is there one person who is brokering all of the communication? What happens if she gets sick or leaves the course? Now we have numbers to discuss this – for more, tune in to the next instalment!
Humanities Intensive Learning + Teaching, Day 1, Maryland Institute for Technology in the Humanities, #hilt2014
Posted: August 6, 2014 Filed under: Education | Tags: cMOOC, data visualisation, Elijah Meeks, Florence, graphs, HILT, HILT 2014, Medicis, MITH, MOOC, network, network visualisation, visualisation, xMOOC Leave a commentI’m attending the Humanities Intensive Learning + Teaching courses at Maryland Institute for Technology in the Humanities, #hilt2014, for the second year running. Last year was Matt Jocker’s excellent course on R and this year I’m attending Elijah Meek’s course on Network Analysis and Visualisation. The first day we covered network basics and why you might want to actually carry out visualisation across graphs – and what the hell are graphs anyway?
Graphs, put simply, are a collection of things and connections between those things. Now that I’ve killed every mathematician reading this blog, let’s continue. I’ve done a lot of work on this before in the Internet Topology Zoo but it’s now looking like analysis of large-scale online education is something I have to get good at, so it seemed a great opportunity to come and see how the DH community do this and get access to some mature processes and tools.
Why is this important as a visualisation (or representation, thanks, Elijah) target? Because pictures tell stories well and we can use this to drive argument and make change.
Let’s consider the Medici, the family who dominated Florence from the 1400s to the 18th century. While not being the most wealthy and powerful families at the outset, they were (by marriage and arrangements) one of the most well connected families. In fact, the connections from some groups of families to other families had to go through the Medicis – which made them more important because of their role in the network.

Padget & Ansell’s network of marriages and economic relationships between Florentine families. (from http://www.themacroscope.org/?page_id=308)
The graph makes the relationship and the importance clear. (Insert toast about Boston, Lowells and Cabots here.)
In graphs of the Internet, everything is connected to the Internet by definition, so we don’t have any isolated elements. (We do have networks that don’t connect to the Internet, such as super-secret defence networks and some power stations – not as many as there used to be – but we’re interested in the Internet.) It is possible to analyse communities and show ways that some people/entities/organisations are not connected to each other. Sometimes they form disconnected clusters, sometimes they sit by themselves, and this is where my interest comes in, because we can use this to analyse student behaviour as a learning community.
A student who enrols in your course is notionally part of your community but this is an administrative view of the network. It’s only when they take part in any learning and teaching activity that they actually become part of the learning community. Suddenly all of the students in your network can have a range of different types of connection, which is a good start to finding categories to talk about behaviour in large on-line courses, because now we can easily separate enrolment from attendance, attendance from viewing, viewing from participation in discussion, and discussion from submission of work. I hope to have a good look into this to find some nice (convenient) mathematical descriptions of the now defunct cMOOC/xMOOC distinction and how we can encourage behaviour to get students to form robust learning networks.
As we can see from the Medicis, the Medicis used their position in order to gain power – it wasn’t in their interests to form additional connections to make the network resilient if they fell on hard times. However, learning networks don’t want a central point that can fail (central points of failure are to be avoided in most contexts!) and this is why a learning community is so important. If students are connected to many other students and their lecturing staff, then the chances of one relationship (connection) failing causing the whole network to fail is very low. Some people are, naturally, very important in a learning community: we’d hope that instructors would be, tutors would be, and key students who handle discussions or explanations also would be. However, if we have very few of these important people, then everyone else is depending upon this small number to stay connected and this puts a lot of stress on these people and makes it easy for your network to fall apart.
I’ll talk more about this tomorrow and hit you with you some definitions!
ITiCSE 2014: Monday, Keynote 1, “New Technology, New Learning?” #ITiCSE2014 #ITiCSE
Posted: June 23, 2014 Filed under: Education | Tags: active learning, ambient wood, authenticity, co-creation, collaborative learning, community, computer science education, context, curriculum, education, educational problem, educational research, gamification, higher education, in the student's head, ITiCSE, ITiCSE 2014, learning, MOOC, panopticon, passive learning, peer instruction, peerwise, social media, students, teaching, teaching approaches, thinking Leave a commentThis keynote was presented by Professor Yvonne Rogers, from University College of London. The talk was discussing how we could make learning more accessible and exciting for everyone and encourage students to think, to create and share our view. Professor Rogers started by sharing a tweet by Conor Gearty on a guerrilla lecture, with tickets to be issued at 6:45pm, for LSE students. (You can read about what happened here.) They went to the crypt of Westminster Cathedral and the group, split into three smaller groups, ended up discussing the nature of Hell and what it entailed. This was a discussion on religion but, because of the way that it was put together, it was more successful than a standard approach – context shift, suspense driving excitement and engagement. (I wonder how much suspense I could get with a guerrilla lecture on polymorphism… )
Professor Rogers says that suspense matters, as the students will be wondering what is coming next, and this will hopefully make them more inquisitive and thus drive them along the path to scientific enquiry. The Ambient Wood was a woodland full of various technologies for student pairs, with technology and probes, an explorative activity. You can read about the Ambient Wood here. The periscope idea ties videos into the direction that you are looking – a bit like Google Glass without a surveillance society aspect (a Woodopticon?). (We worked on similar ideas at Adelaide for an early project in the Arts Precinct to allow student exploration to drive the experience in arts, culture and botanical science areas.) All of the probes were recorded in the virtual spatial environment matching the wood so that, after the activity, the students could then look at what they did. Thus, a group of 10-12 year olds had an amazing day exploring and discovering, but in a way that was strongly personalised, with an ability to see it from the bird’s eye view above them.
And, unsurprisingly, we moved on to MOOCs, with an excellent slide on MOOC HYSTERIA. Can we make these as engaging as the guerrilla lecture or the ambient wood?

MOOCs, as we know, are supposed to increase our reach and access to education but, as Professor Rogers noted, it is also a technology that can make the lecturer a “bit of a star”. This is one of the most honest assessments of some of the cachet that I’ve heard – bravo, Professor Rogers. What’s involved in a MOOC? Well, watching things, doing quizzes, and there’s probability a lot of passive, rather than active, learning. Over 60% of the people who sign up to do a MOOC, from the Stanford experience, have a degree – doing Stanford for free is a draw for the already-degreed. How can we make MOOCs fulfil their promise, give us good learning, give us active learning and so on? Learning analytics give us some ideas and we can data mine to try and personalise the course to the student. But this has shifted what our learning experience is and do we have any research to show the learning value of MOOCs?
In 2014, 400 students taking a Harvard course:
- Learned in a passive way
- Just want to complete
- Take the easy option
- Were unable to apply what they learned
- Don’t reflect on or talk to their colleagues about it.
Which is not what we want? What about the Flipped Classroom? Professor Rogers attributed this to Khan but I’m not sure I agree with this as there were people, Mazur for example, who were doing this in Peer Instruction well before Khan – or at least I thought so. Corrections in the questions please! The idea of the flip is that we don’t have content delivery in lectures with the odd question – we have content beforehand and questions in class. What is the reality?
- Still based on chalk and talk.
- Is it simply a better version of a bad thing?
- Are students more motivated and more active?
- Very labour-intensive for the teacher.
So where’s the evidence? Well, it does increase interaction in class between instructors and students. It does allow for earlier identification of misconceptions. Pierce and Fox, 2012, found that it increased exam results for pharmacology students. It also fostered critical thinking in case scenarios. Maybe this will work for 10s-100s – what about classes of thousands? Can we flip to this? (Should we even have classes of this size is another good question)
Then there’s PeerWise, Paul Denny (NZ), where there is active learning in which students create questions, answer them and get feedback. Students create the questions and then they get to try other student’s questions and can then rate the question and rate the answer. (We see approaches like this, although not as advanced, in other technologies such as Piazza.)
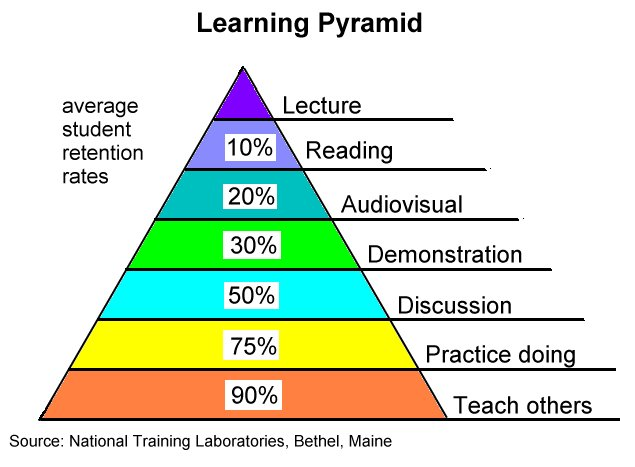
How effective is this? Performance in PeerWise correlated with exam marks (Anyadi, Green and Tang, 2013), with active student engagement. It’s used for revision before the exams, and you get hihg-quality questions and answers, while supporting peer interaction. Professor Rogers then showed the Learning Pyramid, from the National Training Laboratories, Bethel, Maine. The PeerWise system plays into the very high retention area.
Professor Rogers then moved on to her own work, showing us a picture of the serried rank nightmare of a computer-based classroom: students in rows, isolated and focused on their screens. Instead of ‘designing for one’, why don’t we design to orchestrate shared activities, with devices that link to public displays and can actively foster collaboration. One of Professor Rogers’ students is looking at ways to share simulations across tablets and screens. This included “4Decades“, a a simulation of climate management, with groups representing the different stakeholders to loo at global climate economics. We then saw a video that I won’t transcribe. The idea is that group work encourages discussion, however we facilitate it, and this tends to leading to teaching others in the sharing of ideas. Another technology that Professor Rogers’ group have developed in this space is UniPad: orchestrating collaborate activities across multiple types of devices, with one device per 6-7 students, and used in classes without many researchers present. Applications of this technology include budgeting for students (MyBank), with groups interacting and seeing the results on a public display. Given how many students operate in share houses collaboratively, this is quite an interesting approach to the problem. From studies on this, all group members participated and used the tablet as a token for discussion, taking ownership of a part of the problem. This also extended to reflection on other’s activities, including identifying selfish behaviour on the part of other people. (Everyone who has had flatmates is probably groaning at the moment. Curse you, Love Tarot Pay-By-The-Minute Telephone Number, which cost me and my flatmates a lot of dollars after a flatmate skipped out on us.)
The next aspect Professor Rogers discussed was physical creation toolkits, such as MaKey MaKey, where you can build alternative input for a computer, based on a simple printed circuit board with alligator clips and USB cables. The idea is simple: you can turn anything you like into a keyboard key. Demonstrations included a banana space bar, a play dough MarioKart gamepad, and many other things (a water bowl in front of the machine became a cat-triggered photo booth). This highlights one of the most important aspects of thinking about learning: learning for life. How can we keep people interested in learning in the face of busy, often overfull, lives when many people still think about learning as something that had to be endured on their pathway into the workforce? (Paging my climbing friends with their own climbing wall: you could make the wall play music if you wanted to. Just saying.)
One of the computers stopped working during a trial of the MaKey MaKey system with adult learners and the collaboration that ensued changed the direction of the work and more people were assigned to a single kit. Professor Rogers showed a small video of a four-person fruit orchestra of older people playing Twinkle Twinkle Little Star. (MORE KIWI!) This elicited a lot of ideas, including for their grandchildren and own parent, transforming exercise to be more fun, to help people learn fundamental knowledge skills and give good feedback. We often heavily intervene in the learning experience and the reflection of the Fruit Orchestra was that intervening less in self-driven activities such as MaKey MaKey might be a better way to go, to increase autonomy and thus drive engagement.
Next was the important question: How can we gets to create and code, where coding is just part of the creating? Can we learn to code differently beyond just choosing a particular language? We have many fascinating technologies but what is the suite of tools over the top that will drive creativity and engagement in this area, to produce effective learning? The short video shown demonstrated a pop-out prefabricated system, where physical interfaces and gestures across those represented coding instructions: coding without any typing at all. (Previous readers will remember my fascination with pre-literate programming.) This early work, electronics on a sheet, is designed to be given away because the production cost is less than 3 Euros. The project is called “code me” from University College London and is designed to teach logic without people realising it: the fundamental building block of computational thinking. Future work includes larger blocks with Bluetooth input and sensors. (I can’t find a web page for this.)
What role should technology play in learning? Professor Rogers mentioned thinking about this in two ways. The inside learning using technology to think about the levels students to reach to foster attainment: personalise, monitor, motivate, flexible, adaptive. The outside learning approach is to work with other people away from the screen: collaborate, create, connect, reflect and play. Professor Rogers believes that the choice is ours but that technology should transform learning to make it active, creative, collaborative, exciting (some other things I didn’t catch) and to recognise the role of suspense in making people think.
An interesting and thought-provoking keynote.
CSEDU, Day 2, Invited Talk, “How are MOOCs Disrupting the Educational Landscape?”, (#CSEDU14 #AdelEd)
Posted: April 2, 2014 Filed under: Education | Tags: Avalanche, cMOOC, computer supported education, CSEDU, csedu14, education, educational landscape, FutureLearn, higher education, Hugh Davis, learning, MOOC, moocs, Napster, Saints FC, Southampton, student, xMOOC 3 CommentsI’ve already spent some time with Professor Hugh Davis, from Southampton, and we’ve had a number of discussions already around some of the matters we’re discussing today, including the issue when you make your slides available before a talk and people react to the content of the slides without having the context of the talk! (This is a much longer post for another time.) Hugh’s slides are available at http://www.slideshare.net/hcd99.
As Hugh noted, this is a very timely topic but he’s planning to go through the slides at speed so I may not be able to capture all of it. He tweeted his slides earlier, as I noted, and his comment that he was going to be debunking things earned him a minor firestorm. But, to summarise, his answer to the questions is “not really, probably” but we’ll come back to this. For those who don’t know, Southampton is about 25,000 students, Russell Group and Top 20 in the UK, with a focus on engineering and oceanography.
Back in 2012, the VC came back infused with the desire to put together a MOOC (apparently, Australians talked them into it – sorry, Hugh) and in December, 2012, Hugh was called in and asked to do MOOCs. Those who are keeping track will now that there was a lot of uncertainty about MOOCs in 2012 (and there still is) so the meeting called for staff to talk about this was packed – in a very big room. But this reflected excitement on the part of people – which waving around “giant wodges” of money to do blended learning had failed to engender, interestingly enough. Suddenly, MOOCs are more desirable because people wanted to do blended learning as long as you used the term MOOC. FutureLearn was produced and things went from there. (FutureLearn now has a lot of courses in it but I’ve mentioned this before. Interestingly, Monash is in this group so it’s not just a UK thing. Nice one, Monash!)
In this talk, Hugh’s planning to intro MOOCs, discuss the criticism, look at Higher Ed, ask why we are investing in MOOCs, what we can get out of it and then review the criticisms again. Hugh then defined what the term MOOC means: he defined it as a 10,000+, free and open registration, on-line course, where a course runs at a given time with a given cohort, without any guarantee of accreditation. (We may argue about this last bit later on.) MOOCs are getting shorter – with 4-6 weeks being the average for a MOOC, mostly due to fears of audience attrition over time.
The dreaded cMOOC/xMOOC timeline popped up from Florida Institute of Technology’s History of MOOCs:

and then we went into the discussion of the stepped xMOOC with instructor led and a well-defined and assessable journey and the connectivist cMOOC where the network holds the knowledge and the learning comes from connections. Can we really actually truly separate MOOCs into such distinct categories? A lot of xMOOC forums show cMOOC characteristics and you have to wonder how much structure you can add to a cMOOC without it getting “x”-y. So what can we say about the definition of courses? How do we separate courses you can do any time from the cohort structure of the MOOC? The synchronicity of human collision is a very connectivisty idea which is embedded implicitly in every xMOOC because of the cohort.
What do you share? Content or the whole course? In MOOCS, the whole experience is available to you rather than just bits and pieces. And students tend to dip in and out when they can, rather than just eating what is doled out, which suggests that they are engaging. There are a lot of providers, who I won’t list here, but many of them are doing pretty much the same thing.
What makes a MOOC? Short videos, on-line papers, on-line activities, links toe external resources, discussions and off platform activity – but we can no longer depend upon students being physical campus students and thus we can’t guarantee that they share our (often privileged) access to resources such as published journals. So Southampton often offer précis of things that aren’t publicly available. Off platform is an issue for people who are purely on-line.
If you have 13,000 people you can’t really offer to mark all their essays so assessment has to depend upon the self-motivated students and they have to want to understand what is going on – self evaluation and peer review have to be used. This is great, according to Hugh, because we will have a great opportunity to find out more about peer review than we ever have before.
What are the criticisms? Well, they’re demographically pants – most of the students are UK (77%) and then a long way down US (2%), with some minor representation from everywhere else. This isn’t isolated to this MOOC. 70% of MOOC users come from the home country, regardless of where it’s run. Of course, we also know that the people who do MOOCs also tend to have degrees – roughly 70% from the MOOCS@Edinburgh2013 Report #1. These are serial learners (philomaths) who just love to learn things but don’t necessarily have the time or inclination (or resources) to go back to Uni. But for those who register, many don’t do anything, and those who do drop out at about 20% a week – more weeks, more drop-out. Why didn’t people continue? We’ll talk about this later. (See http://moocmoocher.wordpress.com) But is drop out a bad thing? We’ll comeback to this.
Then we have the pedagogy, where we attempt to put learning design into our structure in order to achieve learning outcomes – but this isn’t leading edge pedagogy and there is no real interaction between educators and learners. There are many discussions, and they happen in volume, but this discussion is only over 10% of the community, with 1% making the leading and original contributions. 1% of 10-100,000 can be a big number compared to a standard class room.
What about the current Higher Ed context – let’s look at “The Avalanche Report“. Basically, the education business is doomed!!! DOOOMED, I tell you! which is hardly surprising for a report that mostly originates from a publishing house who wants to be a financially successful disruptor. Our business model is going to collapse! We are going to have our Napster moment! Cats lying down with dogs! In the HE context, fees are going up faster than the value of degree (across most of the developed world, apparently). There is an increased demand for flexibility of study, especially for professional development, in the time that they have. The alternative educational providers are also cashing up and growing. With all of this in mind, on-line education should be a huge growing market and this is what the Avalanche report uses to argue that the old model is doomed. To survive, Unis will have to either globalise or specialise – no room in the middle. MOOCs appear to be the vanguard of the on-line program revolution, which explains why there is so much focus.
Is this the end of the campus? It’s not the end of the pithy slogan, that’s for sure. So let’s look at business models. How do we make money on MOOCs? Freemium where there are free bits and value-added bits The value-adds can be statements of achievement or tutoring. There are also sponsored MOOCs where someone pays us to make a MOOC (for their purposes) or someone pays us to make a MOOC they want (that we can then use elsewhere.) Of course there’s also just the old “having access to student data” which is a very tasty dish for some providers.
What does this mean to Southampton? Well it’s a kind of branding and advertising for Southampton to extend their reputation. It might also generate new markets, bring them in via Informal Learning, move to Non-Formal Learning, then up to the Modules of Formal Learning and then doing whole programmes under more Formal learning. Hugh thinks this is optimistic, not least because not many people have commodified their product into individual modules for starters. Hugh thinks it’s about 60,000 Pounds to make a MOOC, which is a lot of money, and so you need a good business model to justify dropping this wad of cash. But you can get 60K back from enough people with a small fee. Maybe on-line learning is another way to get students than the traditional UK “boarding school” degrees. But the biggest thing is when people accept on-line certification as this is when the product becomes valuable to the people who want the credentials. Dear to my heart, is of course that this also assists in the democratisation of education – which is a fantastic thing.
What can we gain from MOOCs? Well, we can have a chunk of a running course for face-to-face students that runs as a MOOC and the paying students have benefited from interacting with the “free attendees” on the MOOC but we have managed to derive value from it. It also allows us to test things quickly and at scale, for rapid assessment of material quality and revision – it’s hard not to see the win-win here. This automatically drives the quality up as it’s for all of your customers, not just the scraps that you can feed to people who can’t afford to pay for it. Again, hooray for democratisation.
Is this the End of the Lecture? Possibly, especially as we can use the MOOC for content and flip to use the face-to-face for much more valuable things.
There are on-line degrees and there is a lot of money floating around looking for brands that they will go on-line (and by brand, we mean the University of X.) Venture capitalist, publishers and start-ups are sniffing around on-line so there’s a lot of temptation out there and a good brand will mean a lot to the right market. What about fusing this and articulating the degree programme, combining F2F modules. on-line, MOOC, and other aspects.
Ah, the Georgia Tech On-line Masters in Computer Science has been mentioned. This was going to be a full MOOC with free and paying but it’s not fully open, for reasons that I need to put into another post. So it’s called a MOOC but it’s really an on-line course. You may or may not care about this – I do, but I’m in agreement with Hugh.
The other thing about MOOC is that we are looking at big, big data sets where these massive cohorts can be used to study educational approaches and what happens when we change learning and assessment at the big scale.
So let’s address the criticisms:
- Pedagogically Simplistic! Really, as simple as a lecture? Is it worse – no, not really and we have space to innovate!
- No support and feedback! There could be, we’d just have to pay for it.
- Poor completion rates! Retention is not the aim, satisfaction is. We are not dealing with paying students.
- No accreditation! There could be but, again, you’d have to pay for someone to mark and accredit.
- This is going to kill Universities! Hugh doesn’t think so but we’ll had to get a bit nimble. So only those who are not agile and responsive to new business models may have problems – and we may have to do some unbundling.
Who is actually doing MOOCs? The life-long learner crowd (25-65, 505/50 M/F and nearly always have a degree). People who are after a skill (PD and CPD). Those with poor access to Higher education, unsurprisingly. There’s also a tiny fourth cohort who are those who are dipping a toe in Uni and are so small as to be insignificant. (The statistics source was questioned, somewhat abruptly, in the middle of Hugh’s flow, so you should refer to the Edinburgh report.”
The patterns of engagement were identified as auditing, completing and sampling, from the Coursera “Emerging Student Pattersn in Open-Enrollment MOOCs”.
To finish up, MOOCs can give us more choice and more flexibility. Hugh’s happy because people want do online learning and this helps to develop capacity to develop high quality on-line courses. This does lead to challenges for institutional strategy: changing beliefs, changing curriculum design, working with the right academic staff (and who pays them), growing teams of learning designers and multimedia producers, legal matters, speed and agility, budget and marketing. These are commercial operations so you have a lot of commercial issues to worry about! (For our approach, going Creative Commons was one of the best things we every did.)
Is it the end of the campus? … No, not really, Hugh thinks that the campus will keep going and there’ll just be more on-line learning. You don’t stop going to see good music because you’ve got a recording, for example.
And now for the conclusions! MOOCs are a great marketing device and have a good reach for people who were out of reach before, But we can take high quality content and re-embed back into blended learning, use it to drive teaching practice change, get some big data and building capacity for online learning.
This may be the vanguard of on-line disruption but if we’re ready for it, we can live for it!
Well, that was a great talk but goodness, does Hugh speak quickly! Have a look at his slides in the context of this because I think he’s balanced an optimistic view of the benefits with a sufficient cynical eye on the weasels who would have us do this for their own purposes.
