
Learning Analytics: Far away, so close.
Posted: November 5, 2015 Filed under: Education, Opinion | Tags: blogging, community, data, data analytics, education, educational problem, educational research, focus, higher education, learning, learning analytics, measurement, resources, support, teaching, teaching approaches, thinking, universal principles of design 2 CommentsI’ve been thinking about learning analytics and, while some Unis have managed to solve parts of the problem, I think that we need to confront the complexity of the problem, to explain why it’s so challenging. I break it into five key problems.
- Data. We don’t currently collect enough of it to analyse, what we do collect is of questionable value and isn’t clearly tied to mechanisms, and we have not confronted the spectre of what we do with this data when we get it.
- Mechanisms linking learning and what is produced. The mechanisms are complex. Students could be failing for any number of reasons, not the least of which is crap staff. Trying to work out what has happened by looking at outputs is unlikely to help.
- Focus. Generally, we measure things to evaluate people. This means that students do tests to get marked and, even where we mix this up with formative work, they tend to focus on the things that get them marks. That’s because it’s how we’ve trained them. This focus warps measurement into an enforcement and judgment mechanism, rather than a supportive and constructive mechanism.
- Community. We often mandate or apply analytics as an extension of the evaluation focus above. This means that we don’t have a community who are supported by analytics, we have a community of evaluators and the evaluated. This is what we would usually label as a Panopticon, because of the asymmetrical application of this kind of visibility. And it’s not a great environment for education. Without a strong community, why should staff go to the extra effort to produce the things required to generate more data if they can’t see a need for it? This is a terribly destructive loop as it requires learning analytics to work and be seen as effective before you have the data to make learning analytics work!
- Support. When we actually have the data, understand the mechanism, have the right focus and are linked in to the community, we still need the money, time and other resources to provide remediation, to encourage development, to pay for the technology, to send people to places where they can learn. For students and staff. We just don’t have that.
I think almost all Unis are suffering from the same problems. This is a terribly complex problem and it cannot be solved by technology alone.
It’s certainly not as easy as driving car. You know that you make the car go faster by pushing on one pedal and you make it go slower by pushing on another. You look at your speedometer. This measures how often your wheels are rotating and, by simple arithmetic, gives you your speed across the road. Now you can work out the speed you want to travel at, taking into account signs, conditions and things like that. Simple. But this simple, everyday, action and its outcomes are the result of many, many technological, social and personal systems interacting.
The speedometer in the car is giving you continuously available, and reasonably reliable, data on your performance. You know how to influence that performance through the use of simple and direct controls (mechanism). There exists a culture of driver training, road signage and engineering, and car design that provides you with information that ties your personal performance to external achievement (These are all part of support, focus and community). Finally, there are extrinsic mechanisms that function as checks and balances but, importantly, they are not directly tied to what you are doing in the car, although there are strong causative connections to certain outcomes (And we can see elements of support and community in this as we all want to drive on safe roads, hence state support for this is essential).
We are nowhere near the car scenario with learning analytics right now. We have some measurements of learning in the classroom because we grade assignments and mark exams. But these are not continuous feedback, to be consulted wherever possible, and the mechanisms to cause positive change in these are not necessarily clear and direct. I would argue that most of what we currently do is much closer to police enforcement of speed. We ask students to drive a track and, periodically, we check to see if they’re doing the correct speed. We then, often irrevocably from a grading sense, assign a mark to how well they are driving the track and settle back to measure them again later.
Learning analytics faces huge problems before it reaches this stage. We need vast quantities of data that we are not currently generating. Many University courses lack opportunities to demonstrate prowess early on. Many courses offer only two or three measurements of performance to determine the final grade. This trying to guess our speed when the speedo only lights up every three to four weeks after we have pressed a combination of pedals.
The mechanisms for improvement and performance control in University education are not just murky, they’re opaque. If we identify a problem, what happens? In the case of detecting that we are speeding, most of us will slow down. If the police detect you are speeding, they may stop you or (more likely) issue you a fine and eventually you’ll use up your licence and have to stop driving. We just give people low marks or fail them. But, combine this with mechanism issues, and suddenly we need to ask if we’re even ready to try to take action if we had the analytics.
Let’s say we get all the data and it’s reliable and pedagogically sensible. We work out how to link things together. We build community support and we focus it correctly. You run analytics over your data. After some digging, you discover that 70% of your teaching staff simply don’t know how to do their jobs. And, as far as you can see, have been performing at this standard for 20 years.
What do you do?
Until we are ready to listen to what analytics tell us, until we have had the discussion of how we deal with students (and staff) who may wish to opt out, and until we have looked at this as the monstrous, resource-hungry, incredibly complex problem that it is, we really have to ask if we’re ready to take learning analytics seriously. And, given how much money can be spent on this, it’s probably better to work out if we’re going to listen before we invest money into a solution that won’t work because it cannot work.
Designing a MOOC: how far did it reach? #csed
Posted: June 10, 2015 Filed under: Education, Opinion | Tags: advocacy, authenticity, blogging, collaboration, community, computer science education, constructivist, contributing student pedagogy, curriculum, data visualisation, design, education, educational problem, educational research, ethics, feedback, higher education, in the student's head, learning, measurement, MOOC, moocs, principles of design, reflection, resources, students, teaching, teaching approaches, thinking, tools Leave a commentMark Guzdial posted over on his blog on “Moving Beyond MOOCS: Could we move to understanding learning and teaching?” and discusses aspects (that still linger) of MOOC hype. (I’ve spoken about MOOCs done badly before, as well as recording the thoughts of people like Hugh Davis from Southampton.) One of Mark’s paragraphs reads:
“The value of being in the front row of a class is that you talk with the teacher. Getting physically closer to the lecturer doesn’t improve learning. Engagement improves learning. A MOOC puts everyone at the back of the class, listening only and doing the homework”
My reply to this was:
“You can probably guess that I have two responses here, the first is that the front row is not available to many in the real world in the first place, with the second being that, for far too many people, any seat in the classroom is better than none.
But I am involved in a, for us, large MOOC so my responses have to be regarded in that light. Thanks for the post!”
Mark, of course, called my bluff and responded with:
“Nick, I know that you know the literature in this space, and care about design and assessment. Can you say something about how you designed your MOOC to reach those who would not otherwise get access to formal educational opportunities? And since your MOOC has started, do you know yet if you achieved that goal — are you reaching people who would not otherwise get access?”
So here is that response. Thanks for the nudge, Mark! The answer is a bit long but please bear with me. We will be posting a longer summary after the course is completed, in a month or so. Consider this the unedited taster. I’m putting this here, early, prior to the detailed statistical work, so you can see where we are. All the numbers below are fresh off the system, to drive discussion and answering Mark’s question at, pretty much, a conceptual level.
First up, as some background for everyone, the MOOC team I’m working with is the University of Adelaide‘s Computer Science Education Research group, led by A/Prof Katrina Falkner, with me (Dr Nick Falkner), Dr Rebecca Vivian, and Dr Claudia Szabo.
I’ll start by noting that we’ve been working to solve the inherent scaling issues in the front of the classroom for some time. If I had a class of 12 then there’s no problem in engaging with everyone but I keep finding myself in rooms of 100+, which forces some people to sit away from me and also limits the number of meaningful interactions I can make to individuals in one setting. While I take Mark’s point about the front of the classroom, and the associated research is pretty solid on this, we encountered an inherent problem when we identified that students were better off down the front… and yet we kept teaching to rooms with more student than front. I’ll go out on a limb and say that this is actually a moral issue that we, as a sector, have had to look at and ignore in the face of constrained resources. The nature of large spaces and people, coupled with our inability to hover, means that we can either choose to have a row of students effectively in a semi-circle facing us, or we accept that after a relatively small number of students or number of rows, we have constructed a space that is inherently divided by privilege and will lead to disengagement.
So, Katrina’s and my first foray into this space was dealing with the problem in the physical lecture spaces that we had, with the 100+ classes that we had.
Katrina and I published a paper on “contributing student pedagogy” in Computer Science Education 22 (4), 2012, to identify ways for forming valued small collaboration groups as a way to promote engagement and drive skill development. Ultimately, by reducing the class to a smaller number of clusters and making those clusters pedagogically useful, I can then bring the ‘front of the class’-like experience to every group I speak to. We have given talks and applied sessions on this, including a special session at SIGCSE, because we think it’s a useful technique that reduces the amount of ‘front privilege’ while extending the amount of ‘front benefit’. (Read the paper for actual detail – I am skimping on summary here.)
We then got involved in the support of the national Digital Technologies curriculum for primary and middle school teachers across Australia, after being invited to produce a support MOOC (really a SPOC, small, private, on-line course) by Google. The target learners were teachers who were about to teach or who were teaching into, initially, Foundation to Year 6 and thus had degrees but potentially no experience in this area. (I’ve written about this before and you can find more detail on this here, where I also thanked my previous teachers!)
The motivation of this group of learners was different from a traditional MOOC because (a) everyone had both a degree and probable employment in the sector which reduced opportunistic registration to a large extent and (b) Australian teachers are required to have a certain number of professional development (PD) hours a year. Through a number of discussions across the key groups, we had our course recognised as PD and this meant that doing our course was considered to be valuable although almost all of the teachers we spoke to were furiously keen for this information anyway and my belief is that the PD was very much ‘icing’ rather than ‘cake’. (Thank you again to all of the teachers who have spent time taking our course – we really hope it’s been useful.)
To discuss access and reach, we can measure teachers who’ve taken the course (somewhere in the low thousands) and then estimate the number of students potentially assisted and that’s when it gets a little crazy, because that’s somewhere around 30-40,000.
In his talk at CSEDU 2014, Hugh Davis identified the student groups who get involved in MOOCs as follows. The majority of people undertaking MOOCs were life-long learners (older, degreed, M/F 50/50), people seeking skills via PD, and those with poor access to Higher Ed. There is also a small group who are Uni ‘tasters’ but very, very small. (I think we can agree that tasting a MOOC is not tasting a campus-based Uni experience. Less ivy, for starters.) The three approaches to the course once inside were auditing, completing and sampling, and it’s this final one that I want to emphasise because this brings us to one of the differences of MOOCs. We are not in control of when people decide that they are satisfied with the free education that they are accessing, unlike our strong gatekeeping on traditional courses.
I am in total agreement that a MOOC is not the same as a classroom but, also, that it is not the same as a traditional course, where we define how the student will achieve their goals and how they will know when they have completed. MOOCs function far more like many people’s experience of web browsing: they hunt for what they want and stop when they have it, thus the sampling engagement pattern above.
(As an aside, does this mean that a course that is perceived as ‘all back of class’ will rapidly be abandoned because it is distasteful? This makes the student-consumer a much more powerful player in their own educational market and is potentially worth remembering.)
Knowing these different approaches, we designed the individual subjects and overall program so that it was very much up to the participant how much they chose to take and individual modules were designed to be relatively self-contained, while fitting into a well-designed overall flow that built in terms of complexity and towards more abstract concepts. Thus, we supported auditing, completing and sampling, whereas our usual face-to-face (f2f) courses only support the first two in a way that we can measure.
As Hugh notes, and we agree through growing experience, marking/progress measures at scale are very difficult, especially when automated marking is not enough or not feasible. Based on our earlier work in contributing collaboration in the class room, for the F-6 Teacher MOOC we used a strong peer-assessment model where contributions and discussions were heavily linked. Because of the nature of the cohort, geographical and year-level groups formed who then conducted additional sessions and produced shared material at a slightly terrifying rate. We took the approach that we were not telling teachers how to teach but we were helping them to develop and share materials that would assist in their teaching. This reduced potential divisions and allows us to establish a mutually respectful relationship that facilitated openness.
(It’s worth noting that the courseware is creative commons, open and free. There are people reassembling the course for their specific take on the school system as we speak. We have a national curriculum but a state-focused approach to education, with public and many independent systems. Nobody makes any money out of providing this course to teachers and the material will always be free. Thank you again to Google for their ongoing support and funding!)
Overall, in this first F-6 MOOC, we had higher than usual retention of students and higher than usual participation, for the reasons I’ve outlined above. But this material was for curriculum support for teachers of young students, all of whom were pre-programming, and it could be contained in videos and on-line sharing of materials and discussion. We were also in the MOOC sweet-spot: existing degreed learners, PD driver, and their PD requirement depended on progressive demonstration on goal achievement, which we recognised post-course with a pre-approved certificate form. (Important note: if you are doing this, clear up how the PD requirements are met and how they need to be reported back, as early on as you can. It meant that we could give people something valuable in a short time.)
The programming MOOC, Think. Create. Code on EdX, was more challenging in many regards. We knew we were in a more difficult space and would be more in what I shall refer to as ‘the land of the average MOOC consumer’. No strong focus, no PD driver, no geographically guaranteed communities. We had to think carefully about what we considered to be useful interaction with the course material. What counted as success?
To start with, we took an image-based approach (I don’t think I need to provide supporting arguments for media-driven computing!) where students would produce images and, over time, refine their coding skills to produce and understand how to produce more complex images, building towards animation. People who have not had good access to education may not understand why we would use programming in more complex systems but our goal was to make images and that is a fairly universally understood idea, with a short production timeline and very clear indication of achievement: “Does it look like a face yet?”
In terms of useful interaction, if someone wrote a single program that drew a face, for the first time – then that’s valuable. If someone looked at someone else’s code and spotted a bug (however we wish to frame this), then that’s valuable. I think that someone writing a single line of correct code, where they understand everything that they write, is something that we can all consider to be valuable. Will it get you a degree? No. Will it be useful to you in later life? Well… maybe? (I would say ‘yes’ but that is a fervent hope rather than a fact.)
So our design brief was that it should be very easy to get into programming immediately, with an active and engaged approach, and that we have the same “mostly self-contained week” approach, with lots of good peer interaction and mutual evaluation to identify areas that needed work to allow us to build our knowledge together. (You know I may as well have ‘social constructivist’ tattooed on my head so this is strongly in keeping with my principles.) We wrote all of the materials from scratch, based on a 6-week program that we debated for some time. Materials consisted of short videos, additional material as short notes, participatory activities, quizzes and (we planned for) peer assessment (more on that later). You didn’t have to have been exposed to “the lecture” or even the advanced classroom to take the course. Any exposure to short videos or a web browser would be enough familiarity to go on with.
Our goal was to encourage as much engagement as possible, taking into account the fact that any number of students over 1,000 would be very hard to support individually, even with the 5-6 staff we had to help out. But we wanted students to be able to develop quickly, share quickly and, ultimately, comment back on each other’s work quickly. From a cognitive load perspective, it was crucial to keep the number of things that weren’t relevant to the task to a minimum, as we couldn’t assume any prior familiarity. This meant no installers, no linking, no loaders, no shenanigans. Write program, press play, get picture, share to gallery, winning.
As part of this, our support team (thanks, Jill!) developed a browser-based environment for Processing.js that integrated with a course gallery. Students could save their own work easily and share it trivially. Our early indications show that a lot of students jumped in and tried to do something straight away. (Processing is really good for getting something up, fast, as we know.) We spent a lot of time testing browsers, testing software, and writing code. All of the recorded materials used that development environment (this was important as Processing.js and Processing have some differences) and all of our videos show the environment in action. Again, as little extra cognitive load as possible – no implicit requirement for abstraction or skills transfer. (The AdelaideX team worked so hard to get us over the line – I think we may have eaten some of their brains to save those of our students. Thank you again to the University for selecting us and to Katy and the amazing team.)
The actual student group, about 20,000 people over 176 countries, did not have the “built-in” motivation of the previous group although they would all have their own levels of motivation. We used ‘meet and greet’ activities to drive some group formation (which worked to a degree) and we also had a very high level of staff monitoring of key question areas (which was noted by participants as being very high for EdX courses they’d taken), everyone putting in 30-60 minutes a day on rotation. But, as noted before, the biggest trick to getting everyone engaged at the large scale is to get everyone into groups where they have someone to talk to. This was supposed to be provided by a peer evaluation system that was initially part of the assessment package.
Sadly, the peer assessment system didn’t work as we wanted it to and we were worried that it would form a disincentive, rather than a supporting community, so we switched to a forum-based discussion of the works on the EdX discussion forum. At this point, a lack of integration between our own UoA programming system and gallery and the EdX discussion system allowed too much distance – the close binding we had in the R-6 MOOC wasn’t there. We’re still working on this because everything we know and all evidence we’ve collected before tells us that this is a vital part of the puzzle.
In terms of visible output, the amount of novel and amazing art work that has been generated has blown us all away. The degree of difference is huge: armed with approximately 5 statements, the number of different pieces you can produce is surprisingly large. Add in control statements and reputation? BOOM. Every student can write something that speaks to her or him and show it to other people, encouraging creativity and facilitating engagement.
From the stats side, I don’t have access to the raw stats, so it’s hard for me to give you a statistically sound answer as to who we have or have not reached. This is one of the things with working with a pre-existing platform and, yes, it bugs me a little because I can’t plot this against that unless someone has built it into the platform. But I think I can tell you some things.
I can tell you that roughly 2,000 students attempted quiz problems in the first week of the course and that over 4,000 watched a video in the first week – no real surprises, registrations are an indicator of interest, not a commitment. During that time, 7,000 students were active in the course in some way – including just writing code, discussing it and having fun in the gallery environment. (As it happens, we appear to be plateauing at about 3,000 active students but time will tell. We have a lot of post-course analysis to do.)
It’s a mistake to focus on the “drop” rates because the MOOC model is different. We have no idea if the people who left got what they wanted or not, or why they didn’t do anything. We may never know but we’ll dig into that later.
I can also tell you that only 57% of the students currently enrolled have declared themselves explicitly to be male and that is the most likely indicator that we are reaching students who might not usually be in a programming course, because that 43% of others, of whom 33% have self-identified as women, is far higher than we ever see in classes locally. If you want evidence of reach then it begins here, as part of the provision of an environment that is, apparently, more welcoming to ‘non-men’.
We have had a number of student comments that reflect positive reach and, while these are not statistically significant, I think that this also gives you support for the idea of additional reach. Students have been asking how they can save their code beyond the course and this is a good indicator: ownership and a desire to preserve something valuable.
For student comments, however, this is my favourite.
I’m no artist. I’m no computer programmer. But with this class, I see I can be both. #processingjs (Link to student’s work) #code101x .
That’s someone for whom this course had them in the right place in the classroom. After all of this is done, we’ll go looking to see how many more we can find.
I know this is long but I hope it answered your questions. We’re looking forward to doing a detailed write-up of everything after the course closes and we can look at everything.
EduTech AU 2015, Day 2, Higher Ed Leaders, “Change and innovation in the Digital Age: the future is social, mobile and personalised.” #edutechau @timbuckteeth
Posted: June 3, 2015 Filed under: Education | Tags: advocacy, community, curriculum, design, education, educational problem, edutech2015, feedback, Generation Why, higher education, in the student's head, learning, Mayflower, Mayflower steps, measurement, Plymouth University, principles of design, reflection, resources, steve wheeler, student perspective, students, teaching, teaching approaches, technology, thinking, tools Leave a commentAnd heeere’s Steve Wheeler (@timbuckteeth)! Steve is an A/Prof of Learning Technologies at Plymouth in the UK. He and I have been at the same event before (CSEDU, Barcelona) and we seem to agree on a lot. Today’s cognitive bias warning is that I will probably agree with Steve a lot, again. I’ve already quizzed him on his talk because it looked like he was about to try and, as I understand it, what he wants to talk about is how our students can have altered expectations without necessarily becoming some sort of different species. (There are no Digital Natives. No, Prensky was wrong. Check out Helsper, 2010, from the LSE.) So, on to the talk and enough of my nonsense!
Steve claims he’s going to recap the previous speaker, but in an English accent. Ah, the Mayflower steps on the quayside in Plymouth, except that they’re not, because the real Mayflower steps are in a ladies’ loo in a pub, 100m back from the quay. The moral? What you expect to be getting is not always what you get. (Tourists think they have the real thing, locals know the truth.)
“Any sufficiently advanced technology is indistinguishable from magic” – Arthur C. Clarke.
Educational institutions are riddled with bad technology purchases where we buy something, don’t understand it, don’t support it and yet we’re stuck with it or, worse, try to teach with it when it doesn’t work.
Predicting the future is hard but, for educators, we can do it better if we look at:
- Pedagogy first
- Technology next (that fits the technology)
Steve then plugs his own book with a quote on technology not being a silver bullet.
But who will be our students? What are their expectations for the future? Common answers include: collaboration (student and staff), and more making and doing. They don’t like being talked at. Students today do not have a clear memory of the previous century, their expectations are based on the world that they are living in now, not the world that we grew up in.
Meet Student 2.0!
The average digital birth of children happens at about six months – but they can be on the Internet before they are born, via ultrasound photos. (Anyone who has tried to swipe or pinch-zoom a magazine knows why kids take to it so easily.) Students of today have tools and technology and this is what allows them to create, mash up, and reinvent materials.
What about Game Based Learning? What do children learn from playing games
Three biggest fears of teachers using technology
- How do I make this work?
- How do I avoid looking like an idiot?
- They will know more about it than I do.
Three biggest fears of students
- Bad wifi
- Spinning wheel of death
- Low battery
The laptops and devices you see in lectures are personal windows on the world, ongoing conversations and learning activities – it’s not purely inattention or anti-learning. Student questions on Twitter can be answered by people all around the world and that’s extending the learning dialogue out a long way beyond the classroom.
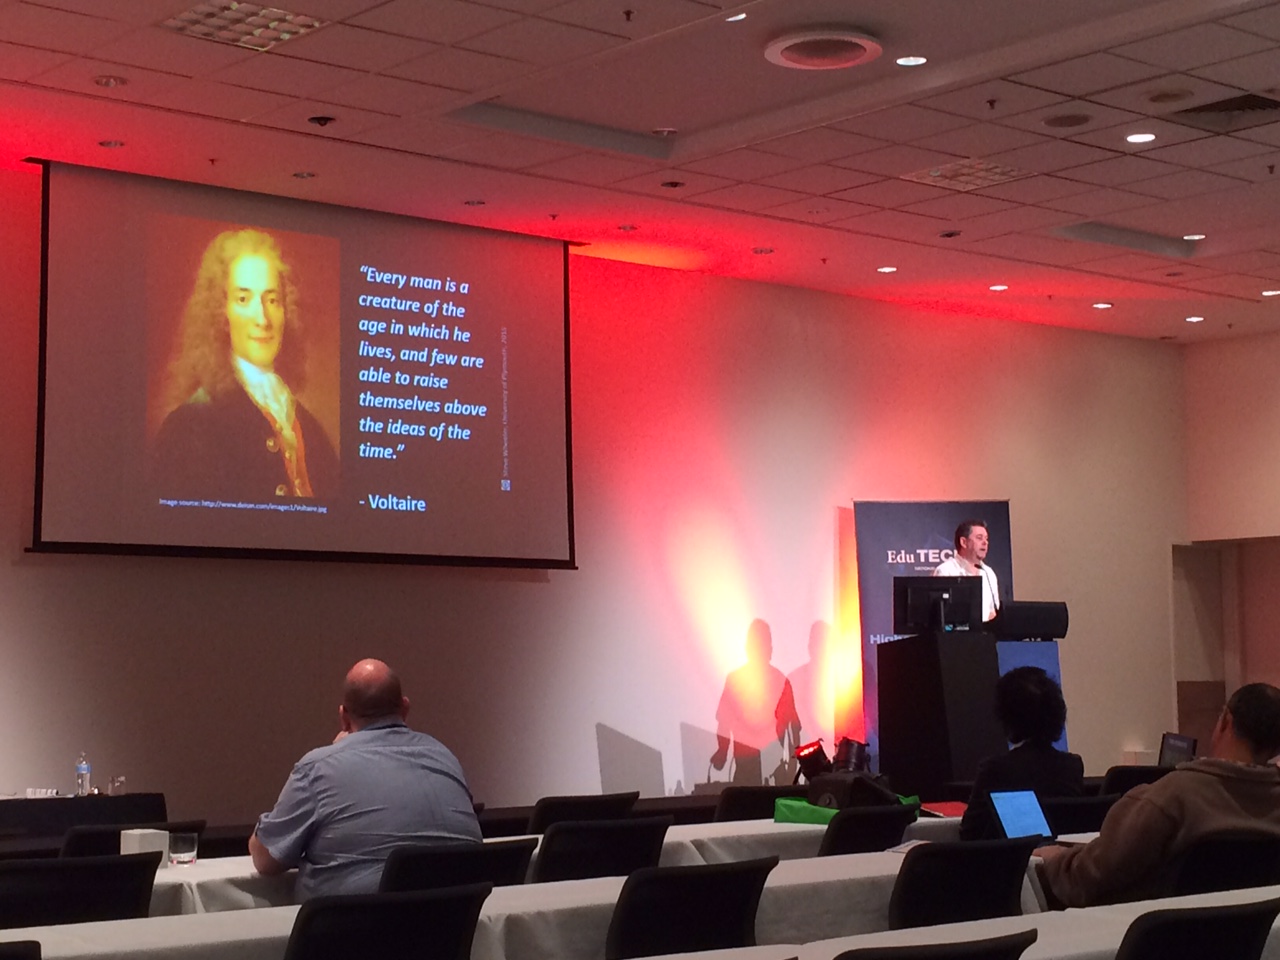
One of these is Voltaire, one is Steve Wheeler.
Voltaire said that we were products of our age. Walrick asks how we can prepare students for a future? Steve showed us a picture of him as a young boy, who had been turned off asking questions by a mocking teacher. But the last two years of his schooling were in Holland he went to the Philips flying saucer, which was a technology museum. There, he saw an early video conferencing system and that inspired him with a vision of the future.
Steve wanted to be an astronaut but his career advisor suggested he aim lower, because he wasn’t an American. The point is not that Steve wanted to be an astronaut but that he wanted to be an explorer, the role that he occupies now in education.
Steve shared a quote that education is “about teaching students not subjects” and he shared the awesome picture of ‘named quadrilaterals’. My favourite is ‘Bob. We have a very definite idea of what we want students to write as answer but we suppress creative answers and we don’t necessarily drive the approach to learning that we want.
Ignorance spreads happily by itself, we shouldn’t be helping it. Our visions of the future are too often our memories of what our time was, transferred into modern systems. Our solution spaces are restricted by our fixations on a specific way of thinking. This prevents us from breaking out of our current mindset and doing something useful.
What will the future be? It was multi-media, it was web, but where is it going? Mobile devices because the most likely web browser platform in 2013 and their share is growing.
What will our new technologies be? Thinks get smaller, faster, lighter as they mature. We have to think about solving problems in new ways.
Here’s a fire hose sip of technologies: artificial intelligence is on the way up, touch surfaces are getting better, wearables are getting smarter, we’re looking at remote presence, immersive environments, 3D printers are changing manufacturing and teaching, gestural computing, mind control of devices, actual physical implants into the body…
From Nova Spivak, we can plot information connectivity against social connectivity and we want is growth on both axes – a giant arrow point up to the top right. We don’t yet have a Web form that connects information, knowledge and people – i.e. linking intelligence and people. We’re already seeing some of this with recommenders, intelligent filtering, and sentiment tracking. (I’m still waiting for the Semantic Web to deliver, I started doing work on it in my PhD, mumble years ago.)
A possible topology is: infrastructure is distributed and virtualised, our interfaces are 3D and interactive, built onto mobile technology and using ‘intelligent’ systems underneath.
But you cannot assume that your students are all at the same level or have all of the same devices: the digital divide is as real and as damaging as any social divide. Steve alluded to the Personal Learning Networking, which you can read about in my previous blog on him.
How will teaching change? It has to move away from cutting down students into cloned templates. We want students to be self-directed, self-starting, equipped to capture information, collaborative, and oriented towards producing their own things.
Let’s get back to our roots:
- We learn by doing (Piaget, 1950)
- We learn by making (Papert, 1960)
Just because technology is making some of this doing and making easier doesn’t mean we’re making it worthless, it means that we have time to do other things. Flip the roles, not just the classroom. Let students’ be the teacher – we do learn by teaching. (Couldn’t agree more.)
Back to Papert, “The best learning takes place when students take control.” Students can reflect in blogging as they present their information a hidden audience that they are actually writing for. These physical and virtual networks grow, building their personal learning networks as they connect to more people who are connected to more people. (Steve’s a huge fan of Twitter. I’m not quite as connected as he is but that’s like saying this puddle is smaller than the North Sea.)
Some of our students are strongly connected and they do store their knowledge in groups and friendships, which really reflects how they find things out. This rolls into digital cultural capital and who our groups are.
(Then there was a steam of images at too high a speed for me to capture – go and download the slides, they’re creative commons and a lot of fun.)
Learners will need new competencies and literacies.
Always nice to hear Steve speak and, of course, I still agree with a lot of what he said. I won’t prod him for questions, though.
EduTech AU 2015, Day 2, Higher Ed Leaders, “Innovation + Technology = great change to higher education”, #edutechau
Posted: June 3, 2015 Filed under: Education | Tags: advocacy, collaboration, community, connectivity, design, education, educational problem, educational research, edutech2015, edutechau, ethics, grand challenge, higher education, learning, market forces, measurement, mit, mit media lab, Nicholas, nicholas negroponte, olpc, one laptop per child, principles of design, public education, resources, seymour papert, students, teaching, teaching approaches, thinking, tools Leave a commentBig session today. We’re starting with Nicholas Negroponte, founder of the MIT Media Lab and the founder of One Laptop Per Child (OLPC), an initiative to create/provide affordable educational devices for children in the developing world. (Nicholas is coming to us via video conference, hooray, 21st Century, so this may or not work well in translation to blogging. Please bear with me if it’s a little disjointed.)
Nicholas would rather be here but he’s bravely working through his first presentation of this type! It’s going to be a presentation with some radical ideas so he’s hoping for conversation and debate. The presentation is broken into five parts:
- Learning learning. (Teaching and learning as separate entities.)
- What normal market forces will not do. (No real surprise that standard market forces won’t work well here.)
- Education without curricula. (Learning comes from many places and situations. Understanding and establishing credibility.)
- Where do new ideas come from? (How do we get them, how do we not get in the way.)
- Connectivity as a human right. (Is connectivity a human right or a means to rights such as education and healthcare? Human rights are free so that raises a lot of issues.
Nicholas then drilled down in “Learning learning”, starting with a reference to Seymour Papert, and Nicholas reflected on the sadness of the serious accident of Seymour’s health from a personal perspective. Nicholas referred to Papert’s and Minsky’s work on trying to understand how children and machines learned respectively. In 1968, Seymour started thinking about it and on April, 9, 1970, he gave a talk on his thoughts. Seymour realised that thinking about programs gave insight into thinking, relating to the deconstruction and stepwise solution building (algorithmic thinking) that novice programmers, such as children, had to go through.
These points were up on the screen as Nicholas spoke:
- Construction versus instruction
- Why reinventing the wheel is good
- Coding as thinking about thinking
How do we write code? Write it, see if it works, see which behaviours we have that aren’t considered working, change the code (in an informed way, with any luck) and try again. (It’s a little more complicated than that but that’s the core.) We’re now into the area of transferable skills – it appeared that children writing computer programs learned a skill that transferred over into their ability to spell, potentially from the methodical application of debugging techniques.
Nicholas talked about a spelling bee system where you would focus on the 8 out of 10 you got right and ignore the 2 you didn’t get. The ‘debugging’ kids would talk about the ones that they didn’t get right because they were analsysing their mistakes, as a peer group and as individual reflection.
Nicholas then moved on to the failure of market forces. Why does Finland do so well when they don’t have tests, homework and the shortest number of school hours per day and school days per year. One reason? No competition between children. No movement of core resources into the private sector (education as poorly functioning profit machine). Nicholas identified the core difference between the mission and the market, which beautifully summarises my thinking.
The OLPC program started in Cambodia for a variety of reasons, including someone associated with the lab being a friend of the King. OLPC laptops could go into areas where the government wasn’t providing schools for safety reasons, as it needed minesweepers and the like. Nicholas’ son came to Cambodia from Italy to connect up the school to the Internet. What would the normal market not do? Telecoms would come and get cheaper. Power would come and get cheaper. Laptops? Hmm. The software companies were pushing the hardware companies, so they were both caught in a spiral of increasing power consumption for utility. Where was the point where we could build a simple laptop, as a mission of learning, that could have a smaller energy footprint and bring laptops and connectivity to billions of people.
This is one of the reasons why OLPC is a non-profit – you don’t have to sell laptops to support the system, you’re supporting a mission. You didn’t need to sell or push to justify staying in a market, as the production volume was already at a good price. Why did this work well? You can make partnerships that weren’t possible otherwise. It derails the “ah, you need food and shelter first” argument because you can change the “why do we need a laptop” argument to “why do we need education?” at which point education leads to increased societal conditions. Why laptops? Tablets are more consumer-focused than construction-focused. (Certainly true of how I use my tech.)
(When we launched the first of the Digital Technologies MOOCs, the deal we agreed upon with Google was that it wasn’t a profit-making venture at all. It never will be. Neither we nor Google make money from the support of teachers across Australia so we can have all of the same advantages as they mention above: open partnerships, no profit motive, working for the common good as a mission of learning and collegial respect. Highly recommended approach, if someone is paying you enough to make your rent and eat. The secret truth of academia is that they give you money to keep you housed, clothed and fed while you think. )
Nicholas told a story of kids changing from being scared or bored of school to using an approach that brings kids flocking in. A great measure of success.
Now, onto Education without curricula, starting by talking public versus private. This is a sensitive subject for many people. The biggest problem for public education in many cases is the private educational system, dragging out caring educators to a closed system. Remember Finland? There are no public schools and their educational system is astoundingly good. Nicholas’ points were:
- Public versus private
- Age segregation
- Stop testing. (Yay!)
The public sector is losing the imperative of the civic responsibility for education. Nicholas thinks it doesn’t make sense that we still segregate by ages as a hard limit. He thinks we should get away from breaking it into age groups, as it doesn’t clearly reflect where students are at.
Oh, testing. Nicholas correctly labelled the parental complicity in the production of the testing pressure cooker. “You have to get good grades if you’re going to Princeton!” The testing mania is dominating institutions and we do a lot of testing to measure and rank children, rather than determining competency. Oh, so much here. Testing leads to destructive behaviour.
So where do new ideas come from? (A more positive note.) Nicholas is interested in Higher Ed as sources of new ideas. Why does HE exist, especially if we can do things remotely or off campus? What is the role of the Uni in the future? Ha! Apparently, when Nicholas started the MIT media lab, he was accused of starting a sissy lab with artists and soft science… oh dear, that’s about as wrong as someone can get. His use of creatives was seen as soft when, of course, using creative users addressed two issues to drive new ideas: a creative approach to thinking and consulting with the people who used the technology. Who really invented photography? Photographers. Three points from this section.
- Children: our most precious natural resource
- Incrementalism is the enemy of creativity
- Brain drain
On the brain drain, we lose many, many students to other places. Uni are a place to solve huge problems rather than small, profit-oriented problems. The entrepreneurial focus leads to small problem solution, which is sucking a lot of big thinking out of the system. The app model is leading to a human resource deficit because the start-up phenomenon is ripping away some of our best problem solvers.
Finally, to connectivity as a human right. This is something that Nicholas is very, very passionate about. Not content. Not laptops. Being connected. Learning, education, and access to these, from early in life to the end of life – connectivity is the end of isolation. Isolation comes in many forms and can be physical, geographical and social. Here are Nicholas’ points:
- The end of isolation.
- Nationalism is a disease (oh, so much yes.) Nations are the wrong taxonomy for the world.
- Fried eggs and omelettes.
Fried eggs and omelettes? In general, the world had crisp boundaries, yolk versus white. At work/at home. At school/not at school. We are moving to a more blended, less dichotomous approach because we are mixing our lives together. This is both bad (you’re getting work in my homelife) and good (I’m getting learning in my day).
Can we drop kids into a reading environment and hope that they’ll learn to read? Reading is only 3,500 years old, versus our language skills, so it has to be learned. But do we have to do it the way that we did it? Hmm. Interesting questions. This is where the tablets were dropped into illiterate villages without any support. (Does this require a seed autodidact in the group? There’s a lot to unpack it.) Nicholas says he made a huge mistake in naming the village in Ethiopia which has corrupted the experiment but at least the kids are getting to give press conferences!
Another massive amount of interesting information – sadly, no question time!
EduTECH AU 2015, Day 1, Higher Ed Leaders, “Revolutionising the Student Experience: Thinking Boldly” #edutechau
Posted: June 2, 2015 Filed under: Education | Tags: AI, artificial intelligence, blogging, collaboration, community, data visualisation, deakin, design, education, educational research, edutech2015, edutecha, edutechau, ethics, higher education, learning, learning analytics, machine intelligence, measurement, principles of design, resources, student perspective, students, teaching, thinking, tools, training, watson Leave a commentLucy Schulz, Deakin University, came to speak about initiatives in place at Deakin, including the IBM Watson initiative, which is currently a world-first for a University. How can a University collaborate to achieve success on a project in a short time? (Lucy thinks that this is the more interesting question. It’s not about the tool, it’s how they got there.)
Some brief facts on Deakin: 50,000 students, 11,000 of whom are on-line. Deakin’s question: how can we make the on-line experience as good if not better than the face-to-face and how can on-line make face-to-face better?
Part of Deakin’s Student Experience focus was on delighting the student. I really like this. I made a comment recently that our learning technology design should be “Everything we do is valuable” and I realise now I should have added “and delightful!” The second part of the student strategy is for Deakin to be at the digital frontier, pushing on the leading edge. This includes understanding the drivers of change in the digital sphere: cultural, technological and social.
(An aside: I’m not a big fan of the term disruption. Disruption makes room for something but I’d rather talk about the something than the clearing. Personal bug, feel free to ignore.)
The Deakin Student Journey has a vision to bring students into the centre of Uni thinking, every level and facet – students can be successful and feel supported in everything that they do at Deakin. There is a Deakin personality, an aspirational set of “Brave, Stylish, Accessible, Inspiring and Savvy”.
Not feeling this as much but it’s hard to get a feel for something like this in 30 seconds so moving on.
What do students want in their learning? Easy to find and to use, it works and it’s personalised.
So, on to IBM’s Watson, the machine that won Jeopardy, thus reducing the set of games that humans can win against machines to Thumb Wars and Go. We then saw a video on Watson featuring a lot of keen students who coincidentally had a lot of nice things to say about Deakin and Watson. (Remember, I warned you earlier, I have a bit of a thing about shiny videos but ignore me, I’m a curmudgeon.)
The Watson software is embedded in a student portal that all students can access, which has required a great deal of investigation into how students communicate, structurally and semantically. This forms the questions and guides the answer. I was waiting to see how Watson was being used and it appears to be acting as a student advisor to improve student experience. (Need to look into this more once day is over.)
Ah, yes, it’s on a student home page where they can ask Watson questions about things of importance to students. It doesn’t appear that they are actually programming the underlying system. (I’m a Computer Scientist in a faculty of Engineering, I always want to get my hands metaphorically dirty, or as dirty as you can get with 0s and 1s.) From looking at the demoed screens, one of the shiny student descriptions of Watson as “Siri plus Google” looks very apt.
Oh, it has cheekiness built in. How delightful. (I have a boundless capacity for whimsy and play but an inbuilt resistance to forced humour and mugging, which is regrettably all that the machines are capable of at the moment. I should confess Siri also rubs me the wrong way when it tries to be funny as I have a good memory and the patterns are obvious after a while. I grew up making ELIZA say stupid things – don’t judge me! 🙂 )
Watson has answered 26,000 questions since February, with an 80% accuracy for answers. The most common questions change according to time of semester, which is a nice confirmation of existing data. Watson is still being trained, with two more releases planned for this year and then another project launched around course and career advisors.
What they’ve learned – three things!
- Student voice is essential and you have to understand it.
- Have to take advantage of collaboration and interdependencies with other Deakin initiatives.
- Gained a new perspective on developing and publishing content for students. Short. Clear. Concise.
The challenges of revolution? (Oh, they’re always there.) Trying to prevent students falling through the cracks and make sure that this tool help students feel valued and stay in contact. The introduction of new technologies have to be recognised in terms of what they change and what they improve.
Collaboration and engagement with your University and student community are essential!
Thanks for a great talk, Lucy. Be interesting to see what happens with Watson in the next generations.
EduTECH AU 2015, Day 1, Higher Ed Leaders, Panel Discussion “Leveraging data for strategic advantage” #edutechau
Posted: June 2, 2015 Filed under: Education | Tags: analytics, blogging, data analytics, education, educational problem, educational research, edutech2015, edutechau, ethics, higher education, learning analytics, measurement, principles of design, reflection, students, teaching, teaching approaches Leave a commentA most distinguished panel today. It can be hard to capture panel discussions so I will do what I can to get the pertinent points down. However, the fact that we are having this panel gives you some indication of the importance of this issue. Getting to know your data will make it easier for you to work out what to do in the future.
University of Wollongong (UoW) have set up a University-wide approach to Learning Analytics, with 30 courses in an early adopter program, scaling up over the next two years. Give things that they have learned.
- You need to have a very clear strategic approach for learning analytics. Learning analytics are built into key strategies. This ties in the key governing bodies and gives you the resources.
- Learning analytics need to be tied into IT and data management strategies – separating infrastructure and academics won’t work.
- The only driver for UoW is the academic driver, not data and not technology. All decisions are academic. “what is the value that this adds to maximums student learning, provide personalised learning and early identification of students at risk?”
- Governance is essential. UoW have a two-tier structure, a strategic group and an ethical use of data group. Both essential but separate.
- With data, and learning analytics, comes a responsibility for action. Actions by whom and, then, what action? What are the roles of the student, staff and support services? Once you have seen a problem that requires intervention, you are obliged to act.
I totally agree with this. I have had similar arguments on the important nature of 5.
The next speaker is from University of Melbourne (UoM), who wanted to discuss a high-level conceptual model. At the top of the model is the term ‘success’, a term that is not really understood or widely used, at national or local level. He introduced the term of ‘education analytics’ where we look at the overall identity of the student and interactions with the institution. We’re not having great conversations with students through written surveys so analytics can provide this information (a controversial approach). UoM want a new way, a decent way, to understand the student, rather than taking a simplistic approach. I think he mentioned intersectionality but not in a way that I really understood it.
Most of what determines student success in Australia isn’t academic, it’s personal, and we have to understand that. We also can’t depend on governments to move this, it will have to come out of the universities.
The next speaker is from University of Sydney, who had four points he wanted to make.
He started by talking about the potential of data. Data is there but it’s time to leverage it. Why are institutions not adopting LA as fast as they could? We understand the important of data-backed decision making.
Working with LA requires a very broad slice across the University – IT, BI, Academics, all could own it and they all want to control it. We want to collaborate so we need clear guidance and clear governance. Need to identify who is doing what without letting any one area steal it.
Over the last years, we have forgotten about the proximity of data. It’s all around us but many people think it’s not accessible. How do we get our hands on all of this data to make information-backed decisions in the right timeframe? This proximity applies to students as well, they should be able to see what’s going on as a day-by-day activity.
The final panellist is from Curtin University. Analytics have to be embedded into daily life and available with little effort if they’re going to be effective. At Curtin, analytics have a role in all places in the Uni, library, learning, life-long learning, you name it. Data has to be unified and available on demand. What do users want?
Curtin focused on creating demand – can they now meet that demand with training and staffing, to move to the next phase of attraction?
Need to be in a position of assisting everyone. This is a new world so have to be ready to help people quite a lot in the earlier stages. Is Higher Ed ready for the type of change that Amazon caused in the book market? Higher Ed can still have a role as validator of education but we have to learn to work with new approaches before our old market is torn out form underneath us.
We need to disentangle what the learner does from what the machine does.
That finished off the initial panel statements and then the chair moved to ask questions to the panel. I’ll try and summarise that.
One question was about the issue of security and privacy of student information. Can we take data that we used to help a student to complete their studies and then use that to try and recruit a new student, even anonymised? UoW mentioned that having a separate data ethics group for exactly this reason. UoW started this with a student survey, one question of which is “do you feel like this is Big Brother”. Fortunately, most felt that it wasn’t but they wanted to know what was going to happen with the data and the underlying driver had to be to help them to succeed.
Issuing a clear policy and embracing transparency is crucial here.
UoM made the point that much work is not built on a strong theoretical basis and a great deal of it is measuring what we already think we care about. There is a lot of value in clearly identifying what works and what doesn’t.
That’s about it for this session. Again, so much to think about.
EduTech Australia 2015, Day 1, Session 2, Higher Education IT Leaders #edutechau
Posted: June 2, 2015 Filed under: Education | Tags: blogging, community, customer-centric, design, digital technologies, education, educational research, edutech2015, edutechau, higher education, learning technologies, mark gregory, measurement, principles of design, resources, technology services, the university of adelaide, tools, University of Adelaide Leave a commentI jumped streams (GASP) to attend Mark Gregory’s talk on “Building customer-centric IT services.” Mark is the CIO from my home institutions, the University of Adelaide, and I work closely with him on a couple of projects. There’s an old saying that if you really want to know what’s going on in your IT branch, go and watch the CIO give a presentation away from home, which may also explain why I’m here. (Yes, I’m a dreadful cynic.)
Seven years ago, we had the worst customer-centric IT ratings in Australia and New Zealand, now we have some of the highest. That’s pretty impressive and, for what it’s worth, it reflects my experiences inside the institution.
Mark showed a picture of the ENIAC team, noting that the picture had been mocked up a bit, as additional men had been staged in the picture, which was a bit strange even the ENIAC team were six women to one man. (Yes, this has been going on for a long time.) His point was that we’ve come a long way from he computer attended by acolytes as a central resource to computers everywhere that everyone can access and we have specifically chosen. Technology is now something that you choose rather than what you put up with.
For Adelaide, on a typical day we see about 56,000 devices on the campus networks, only a quarter of which are University-provided. Over time, the customer requirement for centralised skills is shrinking as their own skills and the availability of outside (often cloud-based) resources increase. In 2020-2025, fewer and fewer of people on campus will need centralised IT.
Is ERP important? Mark thinks ‘Meh’ because it’s being skinned with Apps and websites, the actual ERP running in the background. What about networks? Well, everyone’s got them. What about security? That’s more of an imposition and it’s used by design issues. Security requirements are not a crowd pleaser.
So how will our IT services change over time?
A lot of us are moving from SOE to BYOD but this means saying farewell to the Standard Operating Environment (SOE). It’s really not desirable to be in this role, but it also drives a new financial model. We see 56,000 devices for 25,000 people – the mobility ship has sailed. How will we deal with it?
We’re moving from a portal model to an app model. The one stop shop is going and the new model is the build-it-yourself app store model where every device is effectively customised. The new user will not hang out in the portal environment.
Mark thinks we really, really need to increase the level of Self Help. A year ago, he put up 16 pages of PDFs and discovered that, over the year, 35,000 people went through self help compared to 70,000 on traditional help-desk. (I question that the average person in the street knows that an IP address given most of what I see in movies. 😉 )
The newer operating systems require less help but student self-help use is outnumbered 5 times by staff usage. Students go somewhere else to get help. Interesting. Our approaches to VPN have to change – it’s not like your bank requires one. Our approaches to support have to change – students and staff work 24×7, so why were we only supporting them 8-6? Adelaide now has a contract service outside of those hours to take the 100 important calls that would have been terrible had they not been fixed.
Mark thinks that IDM and access need to be fixed, it makes up 24% of their reported problems: password broken, I can’t get on and so on.
Security used to be on the device that the Uni owned. This has changed. Now it has to be data security, as you can’t guarantee that you own the device. Virtual desktops and virtual apps can offer data containerisation among their other benefits.
Let’s change the thinking from setting a perimeter to the person themselves. The boundaries are shifting and, let’s be honest, the inside of any network with 30,000 people is going to be swampy anyway.
Project management thinking is shifting from traditional to agile, which gets closer to the customer on shorter and smaller projects. But you have to change how you think about projects.
A lot of tools used to get built that worked with data but now people want to make this part of their decision infrastructure. Data quality is now very important.
The massive shift is from “provide and control” to “advise and enable”. (Sorry, auditors.) Another massive shift is from automation of a process that existed to support a business to help in designing the processes that will support the business. This is a driver back into policy space. (Sorry, central admin branch.) At the same time, Mark believes that they’re transitioning from a functional approach to a customer-centric focus. A common services layer will serve the student, L&T, research and admin groups but those common services may not be developed or even hosted inside the institution.
It’s not a surprise to anyone who’s been following what Mark has been doing, but he believes that the role is shifting from IT operations to University strategy.
Some customers are going to struggle. Some people will always need help. But what about those highly capable individuals who could help you? This is where innovation and co-creation can take place, with specific people across the University.
Mark wants Uni IT organisations to disrupt themselves. (The Go8 are rather conservative and are not prone to discussing disruption, let alone disrupting.)
Basically, if customers can do it, make themselves happy and get what they want working, why are you in their way? If they can do it themselves, then get out of the way except for those things where you add value and make the experience better. We’re helping people who are desperate but we’re not putting as much effort into the innovators and more radical thinkers. Mark’s belief is that investing more effort into collaboration, co-creation and innovation is the way to go.
It looks risky but is it? What happens if you put technology out there? How do you get things happening?
Mark wants us to move beyond Service Level Agreements, which he describes as the bottom bar. No great athlete performs at the top level because of an SLA. This requires a move to meaningful metrics. (Very similar to student assessment, of course! Same problem!) Just because we measure something doesn’t make it meaningful!
We tended to hire skills to provide IT support. Mark believes that we should now be hiring attributes: leaders, drivers, innovators. The customer wants to get somewhere. How can we help them?
Lots to think about – thanks, Mark!
EduTech Australia 2015, Day 1, Session 1, Part 2, Higher Ed Leaders #edutechau
Posted: June 2, 2015 Filed under: Education, Opinion | Tags: community, curriculum, design, Diane Oblinger, differentiator, education, educational problem, educational research, edutech2015, edutechau, ethics, feedback, higher education, in the student's head, learning, measurement, resources, students, teaching, teaching approaches, thinking Leave a commentThe next talk was a video conference presentation, “Designed to Engage”, from Dr Diane Oblinger, formerly of EDUCAUSE (USA). Diane was joining us by video on the first day of retirement – that’s keen!
Today, technology is not enough, it’s about engagement. Diane believes that the student experience can be a critical differentiator in this. In many institutions, the student will be the differentiator. She asked us to consider three different things:
- What would life be like without technology? How does this change our experiences and expectations?
- Does it have to be human-or-machine? We often construct a false dichotomy of online versus face-to-face rather than thinking about them as a continuum.
- Changes in demography are causing new consumption patterns.
Consider changes in the four key areas:
- Learning
- Pathways
- Credentialing
- Alternate Models
To speak to learning, Diane wants us to think about learning for now, rather than based on our own experiences. What will happen when classic college meets online?
Diane started from the premise that higher order learning comes from complex challenges – how can we offer this to students? Well, there are game-based, high experiential activities. They’re complex, interactive, integrative, information gathering driven, team focused and failure is part of the process. They also develop tenacity (with enough scaffolding, of course). We also get, almost for free, vast quantities of data to track how students performed their solving activities, which is far more than “right” or “wrong”. Does a complex world need more of these?
The second point for learning environments is that, sometimes, massive and intensive can go hand-in-hand. The Georgia Tech Online Master of Science in Computer Science, on Udacity , with assignments, TAs and social media engagements and problem-solving. (I need to find out more about this. Paging the usual suspects.)
The second area discussed was pathways. Students lose time, track and credits when they start to make mistakes along the way and this can lead to them getting lost in the system. Cost is a huge issue in the US (and, yes, it’s a growing issue in Australia, hooray.) Can you reduce cost without reducing learning? Students are benefiting from guided pathways to success. Georgia State and their predictive analytics were mentioned again here – leading students to more successful pathways to get better outcomes for everyone. Greatly increased retention, greatly reduced wasted tuition fees.
We now have a lot more data on what students are doing – the challenge for us is how we integrate this into better decision making. (Ethics, accuracy, privacy are all things that we have to consider.)
Learning needs to not be structured around seat time and credit hours. (I feel dirty even typing that.) Our students learn how to succeed in the environments that we give them. We don’t want to train them into mindless repetition. Once again, competency based learning, strongly formative, reflecting actual knowledge, is the way to go here.
(I really wish that we’d properly investigated the CBL first year. We might have done something visionary. Now we’ll just look derivative if we do it three years from now. Oh, well, time to start my own University – Nickapedia, anyone?)
Credentials raised their ugly head again – it’s one of the things that Unis have had in the bag. What is the new approach to credentials in the digital environment? Certificates and diplomas can be integrated into your on-line identity. (Again, security, privacy, ethics are all issues here but the idea is sound.) Example given was “Degreed”, a standalone credentialing site that can work to bridge recognised credentials from provide to employer.
Alternatives to degrees are being co-created by educators and employers. (I’m not 100% sure I agree with this. I think that some employers have great intentions but, very frequently, it turns into a requirement for highly specific training that might not be what we want to provide.)
Can we reinvent an alternative model that reinvents delivery systems, business models and support models? Can a curriculum be decentralised in a centralised University? What about models like Minerva? (Jeff mentioned this as well.)
(The slides got out of whack with the speaker for a while, apologies if I missed anything.)
(I should note that I get twitchy when people set up education for-profit. We’ve seen that this is a volatile market and we have the tension over where money goes. I have the luxury of working for an entity where its money goes to itself, somehow. There are no shareholders to deal with, beyond the 24,000,000 members of the population, who derive societal and economic benefit from our contribution.)
As noted on the next slide, working learners represent a sizeable opportunity for increased economic growth and mobility. More people in college is actually a good thing. (As an aside, it always astounds me when someone suggests that people are spending too much time in education. It’s like the insult “too clever by half”, you really have to think about what you’re advocating.)
For her closing thoughts, Diane thinks:
- The boundaries of the educational system must be re-conceptualised. We can’t ignore what’s going on around us.
- The integration of digital and physical experiences are creating new ways to engage. Digital is here and it’s not going away. (Unless we totally destroy ourselves, of course, but that’s a larger problem.)
- Can we design a better future for education.
Lots to think about and, despite some technical issues, a great talk.
The driverless car is more than transportation technology.
Posted: May 4, 2015 Filed under: Education, Opinion | Tags: AI, blogging, community, data visualisation, driverless car, driverless cars, education, educational problem, Elon Musk, higher education, in the student's head, measurement, principles of design, robots, teaching, teaching approaches, thinking, universal principles of design 1 CommentI’m hoping to write a few pieces on design in the coming days. I’ll warn you now that one of them will be about toilets, so … urm … prepare yourself, I guess? Anyway, back to today’s theme: the driverless car. I wanted to talk about it because it’s a great example of what technology could do, not in terms of just doing something useful but in terms of changing how we think. I’m going to look at some of the changes that might happen. No doubt many of you will have ideas and some of you will disagree so I’ll wait to see what shows up in the comments.
Humans have been around for quite a long time but, surprisingly given how prominent they are in our lives, cars have only been around for 120 years in the form that we know them – gasoline/diesel engines, suspension and smaller-than-buggy wheels. And yet our lives are, in many ways, built around them. Our cities bend and stretch in strange ways to accommodate roads, tunnels, overpasses and underpasses. Ask anyone who has driven through Atlanta, Georgia, where an Interstate of near-infinite width can be found running from Peachtree & Peachtree to Peachtree, Peachtree, Peachtree and beyond!
But what do we think of when we think of cars? We think of transportation. We think of going where we want, when we want. We think of using technology to compress travel time and this, for me, is a classic human technological perspective because we are love to amplify. Cars make us faster. Computers allow us to add up faster. Guns help us to kill better.
So let’s say we get driverless cars and, over time, the majority of cars on the road are driverless. What does this mean? Well, if you look at road safety stats and the WHO reports, you’ll see that about up 40% of traffic fatalities can be straight line accidents (these figures from the Victorian roads department, 2006-2013). That is, people just drive off a straight road and kill themselves. The leading killers overall are alcohol, fatigue, and speed. Driverless cars will, in one go, remove all of these. Worldwide, a million people per year just stopped dying.
But it’s not just transportation. In America, commuting to work eats up from 35-65 hours of your year. If you live in DC, you spend two weeks every year cursing the Beltway. And it’s not as if you can easily work in your car so those are lost hours. That’s not enjoyable driving! That’s hours of frustration, wasted fuel, exposure to burning fuel, extra hours you have to work. The fantasy of the car is driving a convertible down the Interstate in the sunshine, listening to rock, and singing along. The reality is inching forward with the windows up in a 10 year old Nissan family car while stuck between FM stations and having to listen to your second iPod because the first one’s out of power. And it’s the joke one that only has Weird Al on it.
Enter the driverless car. Now you can do some work but there’s no way that your commute will be as bad anyway because we can start to do away with traffic lights and keep the traffic moving. You’ll be there for less time but you can do more. Have a sleep if you want. Learn a language. Do a MOOC! Winning!
Why do I think it will be faster? Every traffic light has a period during which no-one is moving. Why? Because humans need clear signals and need to know what other drivers are doing. A driverless car can talk to other cars and they can weave in and out of the traffic signals. Many traffic jams are caused by people hitting the brakes and then people arrive at this braking point faster than people are leaving. There is no need for this traffic jam and, with driverless cars, keeping distance and speed under control is far easier. Right now, cars move like ice through a vending machine. We want them to move like water.
How will you work in your car? Why not make every driverless car a wireless access point using mesh networking? Now the more cars you get together, the faster you can all work. The I495 Beltway suddenly becomes a hub of activity rather than a nightmare of frustration. (In a perfect world, aliens come to Earth and take away I495 as their new emperor, leaving us with matter transporters, but I digress.)
But let’s go further. Driverless cars can have package drops in them. The car that picks you up from work has your Amazon parcels in the back. It takes meals to people who can’t get out. It moves books around.
But let’s go further. Make them electric and put some of Elon’s amazing power cells into them and suddenly we have a power transportation system if we can manage the rapid charge/discharge issues. Your car parks in the city turn into repair and recharge facilities for fleets of driverless cars, charging from the roof solar and wind, but if there’s a power problem, you can send 1000 cars to plug into the local grid and provide emergency power.
We still need to work out some key issues of integration: cyclists, existing non-converted cars and pedestrians are the first ones that come to mind. But, in my research group, we have already developed passive localisation that works on a scale that could easily be put onto cars so you know when someone is among the cars. Combine that with existing sensors and all a cyclist has to do is to wear a sensor (non-personalised, general scale and anonymised) that lets intersections know that she is approaching and the cars can accommodate it. Pedestrians are slow enough that cars can move around them. We know that they can because slow humans do it often enough!
We start from ‘what could we do if we produced a driverless car’ and suddenly we have free time, increased efficiency and the capacity to do many amazing things.
Now, there are going to be protests. There are going to be people demanding their right to drive on the road and who will claim that driverless cars are dangerous. There will be anti-robot protests. There already have been. I expect that the more … freedom-loving states will blow up a few of these cars to make a point. Anyone remember the guy waving a red flag who had to precede every automobile? It’s happened before. It will happen again.
We have to accept that there are going to be deaths related to this technology, even if we plan really hard for it not to happen, and it may be because of the technology or it may be because of opposing human action. But cars are already killing so may people. 1.2 million people died on the road in 2010, 36,000 from America. We have to be ready for the fact that driverless cars are a stepping stone to getting people out of the grind of the commute and making much better use of our cities and road spaces. Once we go driverless we need to look at how many road accidents aren’t happening, and address the issues that still cause accidents in a driverless example.
Understand the problem. Measure what’s happening. Make a change. Measure again. Determine the impact.
When we think about keeping the manually driven cars on the road, we do have a precedent. If you look at air traffic, the NTSB Accidents and Accident Rates by NTSB Classification 1998-2007 report tells us that the most dangerous type of flying is small private planes, which are more than 5 times more likely to have an accident than commercial airliners. Maybe it will be the insurance rates or the training required that will reduce the private fleet? Maybe they’ll have overrides. We have to think about this.
It would be tempting to say “why still have cars” were it not for the increasingly ageing community, those people who have several children and those people who have restricted mobility, because they can’t just necessarily hop on a bike or walk. As someone who has had multiple knee surgeries, I can assure you that 100m is an insurmountable distance sometimes – and I used to run 45km up and down mountains. But what we can do is to design cities that work for people and accommodate the new driverless cars, which we can use in a much quieter, efficient and controlled manner.
Vehicles and people can work together. The Denver area, Bahnhofstrasse in Zurich and Bourke Street Mall in Melbourne are three simple examples where electric trams move through busy pedestrian areas. Driverless cars work like trams – or they can. Predictable, zoned and controlled. Better still, for cyclists, driverless cars can accommodate sharing the road much more easily although, as noted, there may still be some issues for traffic control that will need to be ironed out.
It’s easy to look at the driverless car as just a car but this is missing all of the other things we could be doing. This is just one example where the replacement of something ubiquitous that might just change the world for the better.
Think. Create. Code. Vis! (@edXOnline, @UniofAdelaide, @cserAdelaide, @code101x, #code101x)
Posted: April 30, 2015 Filed under: Education, Opinion | Tags: #code101x, advocacy, blogging, collaboration, community, curriculum, data visualisation, education, educational problem, educational research, edx, higher education, learning, measurement, MOOC, moocs, reflection, resources, teaching, teaching approaches, thinking, tools, universal principles of design Leave a commentI just posted about the massive growth in our new on-line introductory programming course but let’s look at the numbers so we can work out what’s going on and, maybe, what led to that level of success. (Spoilers: central support from EdX helped a huge amount.) So let’s get to the data!
I love visualised data so let’s look at the growth in enrolments over time – this is really simple graphical stuff as we’re spending time getting ready for the course at the moment! We’ve had great support from the EdX team through mail-outs and Twitter and you can see these in the ‘jumps’ in the data that occurred at the beginning, halfway through April and again at the end. Or can you?

Rapid growth in enrolment! But it’s a little hard to see in this data.
Hmm, this is a large number, so it’s not all that easy to see the detail at the end. Let’s zoom in and change the layout of the data over to steps so we can things more easily. (It’s worth noting that I’m using the free R statistical package to do all of this. I can change one line in my R program and regenerate all of my graphs and check my analysis. When you can program, you can really save time on things like this by using tools like R.)

Now you can see where that increase started and then the big jump around the time that e-mail advertising started, circled. That large spike at the end is around 1500 students, which means that we jumped 10% in a day.
When we started looking at this data, we wanted to get a feeling for how many students we might get. This is another common use of analysis – trying to work out what is going to happen based on what has already happened.
As a quick overview, we tried to predict the future based on three different assumptions:
- that the growth from day to day would be roughly the same, which is assuming linear growth.
- that the growth would increase more quickly, with the amount of increase doubling every day (this isn’t the same as the total number of students doubling every day).
- that the growth would increase even more quickly than that, although not as quickly as if the number of students were doubling every day.
If Assumption 1 was correct, then we would expect the graph to look like a straight line, rising diagonally. It’s not. (As it is, this model predicted that we would only get 11,780 students. We crossed that line about 2 weeks ago.
So we know that our model must take into account the faster growth, but those leaps in the data are changes that caused by things outside of our control – EdX sending out a mail message appears to cause a jump that’s roughly 800-1,600 students, and it persists for a couple of days.
Let’s look at what the models predicted. Assumption 2 predicted a final student number around 15,680. Uhh. No. Assumption 3 predicted a final student number around 17,000, with an upper bound of 17,730.
Hmm. Interesting. We’ve just hit 17,571 so it looks like all of our measures need to take into account the “EdX” boost. But, as estimates go, Assumption 3 gave us a workable ballpark and we’ll probably use it again for the next time that we do this.
Now let’s look at demographic data. We now we have 171-172 countries (it varies a little) but how are we going for participation across gender, age and degree status? Giving this information to EdX is totally voluntary but, as long as we take that into account, we make some interesting discoveries.
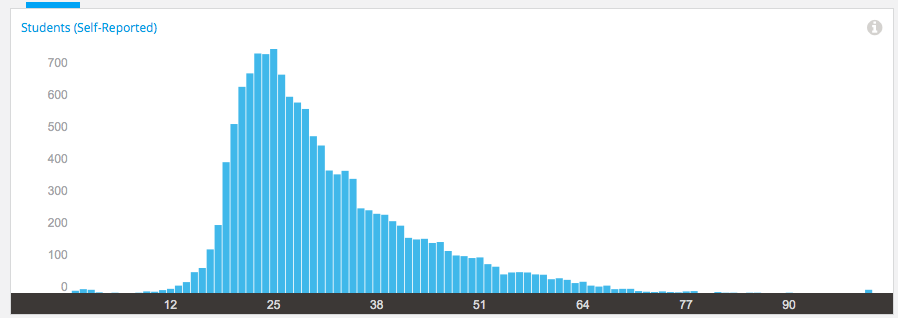
Age demographic data from EdX
Our median student age is 25, with roughly 40% under 25 and roughly 40% from 26 to 40. That means roughly 20% are 41 or over. (It’s not surprising that the graph sits to one side like that. If the left tail was the same size as the right tail, we’d be dealing with people who were -50.)
The gender data is a bit harder to display because we have four categories: male, female, other and not saying. In terms of female representation, we have 34% of students who have defined their gender as female. If we look at the declared male numbers, we see that 58% of students have declared themselves to be male. Taking into account all categories, this means that our female participant percentage could be as high as 40% but is at least 34%. That’s much higher than usual participation rates in face-to-face Computer Science and is really good news in terms of getting programming knowledge out there.
We’re currently analysing our growth by all of these groupings to work out which approach is the best for which group. Do people prefer Twitter, mail-out, community linkage or what when it comes to getting them into the course.
Anyway, lots more to think about and many more posts to come. But we’re on and going. Come and join us!
