
$6.9M Federal Funding for CSER Digital Technologies @cseradelaide @UniofAdelaide @birmo @cpyne @sallyannw
Posted: January 21, 2016 Filed under: Education | Tags: advocacy, community, cser, cser digital technologies, digital technologies, education, educational problem, educational research, ethics, Google, higher education, learning, outreach, resources, STEM, teaching, teaching approaches, tools Leave a commentOur research group, the Computer Science Education Research Group, has been working to support teachers involved in digital technologies for some time. The initial project was a collaboration between Google and the University of Adelaide, with amazing work from Sally-Ann Williams of Google to support us, to produce a support course that was free, open and recognised as professional development for teachers who were coming to terms with the new Digital Technologies (draft) curriculum. Today we are amazed and proud to announce $6.9 million dollars in Federal Funding over the next four years to take this project … well … just about everywhere.
You can read about what we’ve been doing here
I’ll now share Katrina’s message, slightly edited, to the rest of the school.
Today we hosted a visit from Ministers Birmingham and Pyne to announce a new funding agreement to support a national support program for Australian teachers within the Digital Technologies space.
Ministers Birmingham and Pyne confirmed that the Australian Government is providing $6.9 million over four years to the Computer Science Education Research Group at the University of Adelaide to support the roll out, on a national basis, of the teacher professional learning Massive Open Online Course (MOOC) supporting Australian primary and junior secondary teachers in developing skills in implementing the Australian Curriculum: Digital Technologies.
The CSER MOOC program provides free professional development for Australian teachers in the area of Computer Science, and supports research into the learning and teaching of Computer Science in the K-12 space. As part of this new program, we will be able to support teachers in disadvantaged schools and Indigenous schools across Australia in accessing the CSER MOOCs. We will also be able to establish a national lending library program to provide access to the most recent and best digital technologies education equipment to every school.
The Ministers, along with our Executive Dean and the Vice-Chancellor accompanied us to visit a coding outreach event for children run this morning as part of the University’s Bright Sparks STEM holiday program.
Here’s the ministerial announcement.
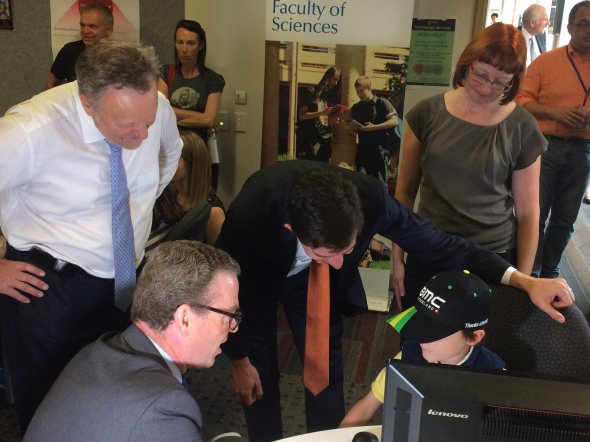
Senator Birmingham, Minister Pyne, Professor Bebbington (VC of the University Adelaide) and A/Prof Katrina Falkner with one of the Bright Spark participants.
In Praise of the Beautiful Machines
Posted: February 1, 2015 Filed under: Education | Tags: advocacy, AI, artificial intelligence, authenticity, beautiful machine, beautiful machines, Bill Gates, blogging, community, design, education, educational problem, ethics, feedback, Google, higher education, in the student's head, Karlheinz Stockhausen, learning, measurement, Philippa Foot, self-driving car, teaching approaches, thinking, thinking machines, tools Leave a comment
Some mechanisms are more beautiful than others.
I posted recently about the increasingly negative reaction to the “sentient machines” that might arise in the future. Discussion continues, of course, because we love a drama. Bill Gates can’t understand why more people aren’t worried about the machine future.
…AI could grow too strong for people to control.
Scientists attending the recent AI conference (AAAI15) thinks that the fears are unfounded.
“The thing I would say is AI will empower us not exterminate us… It could set AI back if people took what some are saying literally and seriously.” Oren Etzioni, CEO of the Allen Institute for AI.
If you’ve read my previous post then you’ll know that I fall into the second camp. I think that we don’t have to be scared of the rise of the intelligent AI but the people at AAAI15 are some of the best in the field so it’s nice that they ask think that we’re worrying about something that is far, far off in the future. I like to discuss these sorts of things in ethics classes because my students have a very different attitude to these things than I do – twenty five years is a large separation – and I value their perspective on things that will most likely happen during their stewardship.
I asked my students about the ethical scenario proposed by Philippa Foot, “The Trolley Problem“. To summarise, a runaway trolley is coming down the tracks and you have to decide whether to be passive and let five people die or be active and kill one person to save five. I put it to my students in terms of self-driving cars where you are in one car by yourself and there is another car with five people in it. Driving along a bridge, a truck jackknifes in front of you and your car has to decide whether to drive ahead and kill you or move to the side and drive the car containing five people off the cliff, saving you. (Other people have thought about in the context of Google’s self-driving cars. What should the cars do?)
One of my students asked me why the car she was in wouldn’t just put on the brakes. I answered that it was too close and the road was slippery. Her answer was excellent:
Why wouldn’t a self-driving car have adjusted for the conditions and slowed down?
Of course! The trolley problem is predicated upon the condition that the trolley is running away and we have to make a decision where only two results can come out but there is no “runaway” scenario for any sensible model of a self-driving car, any more than planes flip upside down for no reason. Yes, the self-driving car may end up in a catastrophic situation due to something totally unexpected but the everyday events of “driving too fast in the wet” and “chain collision” are not issues that will affect the self-driving car.
But we’re just talking about vaguely smart cars, because the super-intelligent machine is some time away from us. What is more likely to happen soon is what has been happening since we developed machines: the ongoing integration of machines into human life to make things easier. Does this mean changes? Well, yes, most likely. Does this mean the annihilation of everything that we value? No, really not. Let me put this in context.
As I write this, I am listening to two compositions by Karlheinz Stockhausen, playing simultaneously but offset, “Kontakte” and “Telemusik“, works that combine musical instruments, electronic sounds, and tape recordings. I like both of them but I prefer to listen to the (intentionally sterile) Telemusik by starting Koktakte first for 2:49 and then kicking off Telemusik, blending the two and finishing on the longer Kontakte. These works, which are highly non-traditional and use sound in very different ways to traditional orchestral arrangement, may sound quite strange and, to an audience familiar with popular music quite strange, they were written in 1959 and 1966 respectively. These innovative works are now in their middle-age. They are unusual works, certainly, and a number of you will peer at your speakers one they start playing but… did their production lead to the rejection of the popular, classic, rock or folk music output of the 1960s? No.
We now have a lot of electronic music, synthesisers, samplers, software-driven music software, but we still have musicians. It’s hard to measure the numbers (this link is very good) but electronic systems have allowed us to greatly increase the number of composers although we seem to be seeing a slow drop in the number of musicians. In many ways, the electronic revolution has allowed more people to perform because your band can be (for some purposes) a band in a box. Jazz is a different beast, of course, as is classical, due to the level of training and study required. Jazz improvisation is a hard problem (you can find papers on it from 2009 onwards and now buy a so-so jazz improviser for your iPad) and hard problems with high variability are not easy to solve, even computationally.
So the increased portability of music via electronic means has an impact in some areas such as percussion, pop, rock, and electronic (duh) but it doesn’t replace the things where humans shine and, right now, a trained listener is going to know the difference.
I have some of these gadgets in my own (tiny) studio and they’re beautiful. They’re not as good as having the London Symphony Orchestra in your back room but they let me create, compose and put together pleasant sounding things. A small collection of beautiful machines make my life better by helping me to create.
Now think about growing older. About losing strength, balance, and muscular control. About trying to get out of bed five times before you succeed or losing your continence and having to deal with that on top of everything else.
Now think about a beautiful machine that is relatively smart. It is tuned to wrap itself gently around your limbs and body to support you, to help you keep muscle tone safely, to stop you from falling over, to be able to walk at full speed, to take you home when you’re lost and with a few controlling aspects to allow you to say when and where you go to the bathroom.
Isn’t that machine helping you to be yourself, rather than trapping you in the decaying organic machine that served you well until your telomerase ran out?
Think about quiet roads with 5% of the current traffic, where self-driving cars move from point to point and charge themselves in between journeys, where you can sit and read or work as you travel to and from the places you want to go, where there are no traffic lights most of the time because there is just a neat dance between aware vehicles, where bad weather conditions means everyone slows down or even deliberately link up with shock absorbent bumper systems to ensure maximum road holding.
Which of these scenarios stops you being human? Do any of them stop you thinking? Some of you will still want to drive and I suppose that there could be roads set aside for people who insisted upon maintaining their cars but be prepared to pay for the additional insurance costs and public risk. From this article, and the enclosed U Texas report, if only 10% of the cars on the road were autonomous, reduced injuries and reclaimed time and fuel would save $37 billion a year. At 90%, it’s almost $450 billion a year. The Word Food Programme estimates that $3.2 billion would feed the 66,000,000 hungry school-aged children in the world. A 90% autonomous vehicle rate in the US alone could probably feed the world. And that’s a side benefit. We’re talking about a massive reduction in accidents due to human error because (ta-dahh) no human control.
Most of us don’t actually drive our cars. They spend 5% of their time on the road, during which time we are stuck behind other people, breathing fumes and unable to do anything else. What we think about as the pleasurable experience of driving is not the majority experience for most drivers. It’s ripe for automation and, almost every way you slice it, it’s better for the individual and for society as a whole.
But we are always scared of the unknown. There’s a reason that the demons of myth used to live in caves and under ground and come out at night. We hate the dark because we can’t see what’s going on. But increased machine autonomy, towards machine intelligence, doesn’t have to mean that we create monsters that want to destroy us. The far more likely outcome is a group of beautiful machines that make it easier and better for us to enjoy our lives and to have more time to be human.
We are not competing for food – machines don’t eat. We are not competing for space – machines are far more concentrated than we are. We are not even competing for energy – machines can operate in more hostile ranges than we can and are far more suited for direct hook-up to solar and wind power, with no intermediate feeding stage.
We don’t have to be in opposition unless we build machines that are as scared of the unknown as we are. We don’t have to be scared of something that might be as smart as we are.
If we can get it right, we stand to benefit greatly from the rise of the beautiful machine. But we’re not going to do that by starting from a basis of fear. That’s why I told you about that student. She’d realised that our older way of thinking about something was based on a fear of losing control when, if we handed over control properly, we would be able to achieve something very, very valuable.
Humanities Intensive Learning + Teaching, Day 5, Maryland Institute for Technology in the Humanities, #hilt2014
Posted: August 17, 2014 Filed under: Education | Tags: clowns, cMOOC, data visualisation, Elijah Meeks, Francis Bacon, Franco Moretti, Gephi, Google, graphs, Hamlet, Hamlet Hamlet Hamlet, HILT, HILT 2014, HITS, Horatio, map, Medicis, MITH, monkey, MOOC, Moretti, network, network visualisation, PageRank, RDF, Shakespeare, Small worlds, Tufte, visualisation, xMOOC, Zelchenko 1 CommentSorry for the delay in completing this – it has been crazy and I prefer to write directly into the live blog, which means a network feed, as I just find it easier to put things together this way. (It’s only been a week (ish) anyway.)
Today (well, then), we looked at modularity and how we could break networks into separate communities. This is important because it helps us to be able to see structure. The human eye is a great tool but it often needs help and modularity is a good way to do this. We have strong ties between components in directed networks (unidirectional) because we have taken the time to say that the link goes this way. We have weak ties in undirected networks because there is no solidity to the association form one side to the other. The more connected something is, the more strongly tied it is to the things it connects to so, when we hunt for communities, we want to take away the least number of connections to produce the largest number of connected communities.
Let’s look at the Hamlet graph (after Moretti) with some colouring added for the various communities and all the connections left in.

It’s hard to see any separation here although the communities can be seen.
Now let’s take out the intra-community links.

Bingo! Poor old Hamlet.
Now we can suddenly see, in terms of dialogue exchanges and interaction, how isolated Hamlet actually is. The members of the court are one community. The invaders are another. Horatio, the proxy for the Danish state, is deeply involved in statehood. Hamlet, however, is more heavily connected to the characters who help with his dawning realisation that something has gone awry. No wonder he goes mad, he’s the Nigel Nofriends of Medieval Denmark, with only the insane Clown Posse and a group of second-rate actors to keep him company.
After this we spent some extensive time working on producing prettier looking graphs with Gephi and using more advanced algorithms to help us to represent what’s going on. We looked at the Twitter data for the conference and came up with this:

Twitter data using the #HILT2014 tag
This shows the separate groups of Twitter user communities who used the HILT2014 hashtag. My small cluster is the small purple arrow bottomish left. We’ve also ranked the size of the data labels based on the significance of that person in the Twitter information chain, using the PageRank algorithm. So, Jim McGrath wins Twitter for HILT 2014! We also look and how important certain links were in the network by looking at edge betweenness to determine which links are used by the most shortest paths and then use this to identify important connected components.
Lots of good hands-on stuff and a very interesting course! I learned a great deal and have already started using it elsewhere.
Humanities Intensive Learning + Teaching, Day 4, Maryland Institute for Technology in the Humanities, #hilt2014
Posted: August 8, 2014 Filed under: Education | Tags: clowns, cMOOC, data visualisation, Elijah Meeks, Francis Bacon, Franco Moretti, Gephi, Google, graphs, Hamlet, Hamlet Hamlet Hamlet, HILT, HILT 2014, HITS, Horatio, map, Medicis, MITH, monkey, MOOC, Moretti, network, network visualisation, PageRank, RDF, Shakespeare, Small worlds, Tufte, visualisation, xMOOC, Zelchenko Leave a commentOr, the alternative title, “The Play Formerly Known as Hamlet”. Today had a lot of fascination discussion where the bipartite nature of our class network became apparent, in terms of the the majority of the class who were Digital Humanists and really understood a detailed close reading of Hamlet – and your humble narrator.
Today we talked about modularity, which allows you to break your network up into separate modules, which makes a lot more sense when you call those modules things like communities, groups or clusters. Can your network be split up into areas where some groups are more connected to each other than they are to adjacent nodes? By doing this, we are trying to expose structural features of the network and, in particular, unexpected aspects of network structure – is there some set of nodes that have a role in the network that we don’t understand? If we talk about this in terms of people, if our social network is made up of small communities with connections between the communities, then we would expect gossip to spread more rapidly inside a community than between the communities. Simple, eh? The approach we take depends upon comparing the structure we have with a model of a random network using the same number of links.
Once we’ve done this, we can use this in a tool, such as Gephi, to clearly illustrate the groups. Here’s a grumpy Dane in illustration.

Hamlet and the various posses of Hamlet. Note the Insane Clown Posse.
I’ve coloured and tagged the network to show the key players in Hamlet, based on Moretti’s analysis of Hamlet, which attached unweighted connections between participants who had direct conversations. Now, we’ve made the size of the nodes reflect how relatively important (in terms of betweenness, the number of paths that must go through this person). If we did this in terms of PageRank, another measure of the relative importance of nodes, based on their connectivity, the nodes in green would jump up in size. But what you should note is that Hamlet and Horatio are roughly the same size and, while Hamlet is much more connected to everyone (quelle surprise, given the play’s named after him), the only thing that we lose if Hamlet disappears is that we no longer can hear from the Insane Clown Posse, Lucianus and the Lord. In purely connected terms he doesn’t appear to be that important. We’d obviously lose a lot of the text if he disappeared but how important is Hamlet in Hamlet?
This led to a lot of discussion in class as to the validity of the original Moretti pamphlet, much of which is core to the entire discussion of Digital Humanities. How valid is any conclusion from a network model such as this when the innate nature of the capture process (to provide the capta) may completely remove the ability to draw certain conclusions? The class discussed the impact on perceived and invisible observers, who strictly don’t have dialogue with each other but potentially have an impact upon other characters and their narrative interactions. (The Moretti pamphlet may be found here.) Moretti had a lot to say about Horatio as a proxy for the state and was very interested in the closeness of Hamlet to everyone else, but (later on) we ran some random network experiments and it turned out to be the type of connections in the network (the clustering coefficient) that was more interesting than the closeness.
We then moved on to a discussion of a number of useful metric for networks, including the clustering effects that tend to indicate intention in the system we’re studying (there’s no real reason for a random network to form a small number of unique clusters unless you tune for it.) We also discussed the Small Worlds of Watts and Strogatz (1998) where you have cliques of nodes (tightly connected clusters) linked together by a smaller number of links, characterised by a power law distribution and a higher clustering coefficient (very basically).
We generated some random graphs to see if we got the structure we saw in Hamlet as noted earlier. Why? Because looking at Hamlet and drawing out information from the structure only has validity if (1) the model is accurate and (2) the situation couldn’t have easily arisen by chance. As noted, we generated a random graph for the same number of nodes and it had a similar average path length and identical diameter – but very different clustering coefficients! So it turns out that Hamlet wasn’t written by a monkey after all.

Don’t laugh, this is Darwin’s skull!
The final part of the session was on dynamic networks. This is the study of networks that change over time and we worked with some data that showed people’s association with an area over time. We could look at this in terms of change in time or in terms of progress through a corpus (chapters are as useful as dates here). What you want is a start date and an end date for the feautres in your network – when should the feature be there and when should it not be there anymore? It turns out that Gephi is quite convenient here, because you can merge a start and end time and end up with a time interval. Not bad, Gephi, not bad. Now we can see when things are active – great if you’re looking to see when students are active in forums or activities, for example. Here’s an example of the difference in the test network between the first and second halves of 2009, with all nodes of zero degree (nodes with no links) removed.

First half of 2009

Second half of 2009
We then played around a lot with a vide variety of animations over time, including ongoing calculations, colour and shape alterations. Basically, it was rather hallucinatory by the end but that may be the Dr Pepper talking. We even got to see the sparklines (Zelchenko/Tufte) for some extra visualisation goodness!
This is one of those classic separations between the things we visualise for ourselves to help us to work out what’s interesting about a dataset and what we would visualise for presentation, especially to non-discipline people. There’s a really big difference between what scientists want to see and what other people want to see – and if we don’t realise that, then we risk either having presentations that don’t communicate enough information or we kill people with minutiae. Look at this – how useful is it for you?

Death by Sparkline!
Another good day but I think there are some very full brains!
Humanities Intensive Learning + Teaching, Day 3, Maryland Institute for Technology in the Humanities, #hilt2014
Posted: August 8, 2014 Filed under: Education | Tags: capta, cMOOC, data visualisation, Elijah Meeks, Florence, Google, graphs, HILT, HILT 2014, HITS, map, Medicis, MITH, MOOC, network, network visualisation, PageRank, RDF, visualisation, xMOOC Leave a commentToday was going to be a short day because we had the afternoon off to go and do cultural things. (I took the afternoon to write papers and catch up on work. I tend to work in both timezones when travelling because otherwise work will eat my head.) Today we explored a lot of filtering in Gephi, which was … interesting and best done in practice. Which we did. So, hooray!
We looked at Multimodal Network Projection throughout the day but I’ll come back to that. We started looking at other ways of determining the important and dependant nodes in a network, starting with the HITS algorithm, which identifies Hubs and Authorities in your network.
Then we moved into the wonderful world of PageRank, Citation networks and how all of these things work. PageRank is, fundamentally, how Google works out which pages to give you. You won’t be able to find out the details of the way that Google runs PageRank because gaming PageRank to serve up pages that you probably didn’t want to see is very big business and highly irritating. Search Engine Optimisers (SEOs) spend a lot of time trying to reverse engineer the algorithm and Google spends a lot of time tweaking it. It’s good we’ve solved all the important problems in the world so we can spend time on this.
Back to PageRank. PageRank looks at the number of links going to a node and what the quality of these links is in order to work out which the most important nodes (pages in the case of Google search) are and, hence, which ones you want. In Digital Humanities, you can use this to identify the most significant element of your model – which, by the way, quickly establishes that Hamlet is not as important as you think. Take that, Hamlet! Want more detail on PageRank? Look here.

From Wikipedia: The more you are pointed to by quality links, the bigger (and happier) you are. Hooray!
In Citations, we want to see how is citing which reference, which is straightforward. In Co-Citation networks, we want to measure how often two documents are cited together. There are many reasons for looking at this, but it helps to detect things like cronyism (someone citing a paper because they like someone rather than because the information is useful). As we discussed before, the Matthew Effect comes in quickly, where frequently cited papers get even more frequently cited because they must be good because they’re cited so frequently. (Tadahhh.)
We also looked at a rather complicated area of multimodal projection, which is going to need some set-up. If you have a set of authors and a set of publications, then you can associate authors with publications and vice versa. However, this means that the only way for two authors to be connected is by sharing a publication and similarly for two publications sharing an author. This is a bipartite network and is very common in this kind of modelling. Now, if we make it more complicated, by moving to a conference and having Authors, Papers and Presentation Sessions, we now have a tripartite network and this becomes very hard to visualise.
What we can do is clean up this network to make it easier to represent by hiding some of the complexity in the connections between nodes. Let’s say we want to look at Authors and Presentation Sessions. Then, while the real network is Authors connected to Papers connected to Presentation Sessions, we can hide the Papers with a network link that effectively says “connects this author via a presentation to this session” and suddenly our network looks like it’s only Authors and Sessions. This level of visual de-cluttering, which is dimensional reduction for those playing along at home, makes it easier for us to visually represent the key information and produce network statistics on these simpler graphs. It’s also a natural fit for triple-based representations like the Resource Description Framework (RDF) because the links in the network now map straight to predicates. (Don’t worry if you didn’t get that last bit, some people just got very excited.)
Finally, we looked at how we collect information. Is it stuff we just pick up from the environment (data) or is it something that we choose the way that we collect it (capta)? (Capta comes from the word for capture. Data is passive. Capta is active. Take that, Bembridge Scholars!) If you think about it, every time you put your data into a spreadsheet, you are imposing a structure upon it, even down to which column is which – it’s not technically data, it’s capta because your interpretation alters it before it even reaches the analysis stage. When it comes to the network that you draw, do you care about the Proximities of elements in your network (location, membership or attitude), the Relations in your network (role, affective, perceptual), the Interactions or the Flows? All of these are going to change what the nodes and edges (links) represent in the network.
The simple rule is that entities are connected by relationships (For those who think in tuples, think “subject, predicate, object” and get your predicate on!) However you do it, you have to pick what’s important in your data, find it, capture it, analyse it and present it in a way that either shows you cool things or supports the cool things that you already know.
A lot to cover today!
After the session, I did some work and then headed off for dinner and board games with some of the other people from the workshop. A nice relaxing night after a rather intense three days.
ASWEC 2014, Day 2, Keynote, “Innovation at Google” (#aswec2014 #AdelEd @scruzin @sallyannw)
Posted: April 8, 2014 Filed under: Education | Tags: alan noble, ASWEC, aswec2014, C++, eat your own dog food, education, Go, Google, higher education, innovation, Java, moon shot, programming languages, Python, software engineering 1 CommentToday’s keynote was given by Alan Noble, Engineering Director for Google Australia and long-term adjunct at the University of Adelaide, who was mildly delayed by Sydney traffic but this is hardly surprising. (Sorry, Sydney!) Whn asked to talk about Google’s Software Engineering (SE) processes, Alan thought “Wow, where do I began?” Alan describes Google’s processes as “organic” and “changing over time” but no one label can describe an organisation that has over 30,000 employees.
So what does Alan mean by “organic”? Each team in Google is empowered to use the tools and processes that work best for them – there is no one true way (with some caveats). The process encouraged is “launch and iterate” and “release early, release often”, which many of us have seen in practice! You launch a bit, you iterate a bit, so you’re growing it piece by piece. As Alan noted, you might think that sounds random, so how does it work? There are some very important underlying commonalities. In the context of SE, you have an underlying platform and underlying common principles.
Everything is built on Google Three (Edit: actually it’s google3, from Alan’s comment below so I’ll change that from here on) – Google’s third iteration of their production codebase, which also enforces certain approaches to the codebase. At the heart of google3 is something called a package, which encapsulates a group of source files, and this is associated with a build file. Not exciting, but standard. Open Source projects are often outside: Chrome and Android are not in google3. Coming to grips with google3 takes months, and can be frustrating for new hires, who can spend weeks doing code labs to get a feeling for the codebase. It can take months before an engineer can navigate google3 easily. There are common tools that operate on this, but not that many of them and for a loose definition of “common”. There’s more than one source code control system, for example. (As a note, any third party packages used inside Google have the heck audited out of them for security purposes, unsurprisingly.) The source code system used to be Perforce by itself but it’s a highly centralised server architecture that hasn’t scaled for how Google is now. Google has a lot of employees spread around the world and this presents problems. (As a note, Sydney is the 10th largest engineering centre for Google outside of Mountain View.) In response to this scaling problem, Google have tried working with the vendor (which didn’t pan out) and have now started to produce their own source control system. Currently, the two source control systems co-exist while migration takes place – but there’s no mandated move. Teams will move based on their needs.
Another tool is a tracking tool called Buganizer which does more than track bugs. What’s interesting is that there are tools that Google use internally that we will never see, to go along with their tools that are developed for public release.
There’s a really strong emphasis on making sure that the tools have well-defined, well-documented and robust APIs. They want to support customisation, which means documentation is really important if sound extensions and new front ends can be built. By providing a strong API, engineering teams can build a sensible front end for their team – although complete reinvention of the wheel is frowned upon and controlled. Some of the front ends get adopted by other teams, such as the Mondrian UI front-end for Buganizer. Another front end for Google Spreadsheets is Maestro. The API philosophy is carried from the internal tools to the external products.
Google makes heavy use of their own external products that they produce, such as Docs, Spreadsheets and Analytics. (See, dog food, the eating thereof.) This also allows the internal testing of pre-release and just-released products. Google Engineers are slightly allergic to GANTT charts but you can support them by writing an extension to Spreadsheets. There is a spreadsheet called Smartsheet that has been approved for internal use but is not widely used. Scripting over existing tools is far more common.
And now we move onto programming languages. Or should I say that we Go onto programming languages. There are four major languages in use at Google: Java, C++, Python, and Go (the Google language). Alan’s a big fan of Go and recommends it for distributed and concurrent systems. (I’ve used it a bit and it’s quite interesting but I haven’t written enough in it to make much comment.) There are some custom languages as well, including scripting languages for production tasks. Teams can use their own language of choice, although it’s unlikely to be Ruby on Rails anytime soon.
Is letting engineers pick their language the key to Google’s success? Is it the common platform? The common tools? No. The platforms, tools and languages won’t matter if your organisational culture isn’t right. If the soil is toxic, the tree won’t grow. Google is in a highly competitive space and have to be continually innovating and improving or users will go elsewhere. The drive for innovation is the need to keep the users insanely happy. Getting the organisational settings right is essential: how do you foster innovation?
Well, how do they do it? First and foremost, it’s about producing a culture of innovation. The wrong culture and you won’t get interesting or exciting software. Hiring matters a LOT. Try to hire people that are smarter than you, are passionate, are quick learners – look for this when you’re interviewing. Senior people at Google need to have technical skills, yes, but they have to be a cultural fit. Will this person be a great addition to the team? (Culture Fit is actually something they assess for – it’s on the form.) Passion is essential: not just for software but for other things as well. If people are passionate about one thing, something, then you’d expect that this passion would flow over into other things in their lives.
Second ingredient: instead of managing, you’re unmanaging. This is why Alan is able to talk today – he’s hired great people and can leave the office without things falling apart. You need to hire technical managers as well, people who have forgotten their technical skills won’t work at Google if they’re to provide a sounding board and be able to mentor members of the team.
The third aspect is being open to sharing information: share, share, share. The free exchange of information is essential in a collaborative environments, based on trust.
“Info sharing is power, info hoarding is impotence.” (Alan Noble)
The fourth thing is to recognise merit. It’s cool to do geeky things. Success is celebrated generously.
Finally, it’s important to empower teams to be agile and to break big projects into smaller, more manageable things. The unit of work at Google is about 3-4 engineers. Have 8 engineers? That’s two 4 person teams. What about meetings? Is face-to-face still important? Yes, despite all the tech. (I spoke about this recently.) Having a rich conversation is very high bandwidth and when you’re in the same room, body language will tell you if things aren’t going across. The 15 minute “stand up” meeting is a common form of meeting: stand up in the workplace and have a quick discussion, then break. There’s also often a more regular weekly meeting which is held in a “fun” space. Google wants you to be within 150m of coffee, food and fuel at all times to allow you to get what you need to keep going, so weekly meetings will be there. There’s also the project kick-off meeting, where the whole team of 20-30 will come together in order to break it down to autonomous smaller units.
People matter and people drive innovation. Googlers are supposed to adapt to fast-paced change and are encouraged to pursue their passions: taking their interests and applying them in new ways to get products that may excite other people. Another thing that happens is TGIF – which is now on Thursday, rather than Friday, where there is an open Q and A session with the senior people at Google. But you also need strong principles underlying all of this people power.
The common guiding principles that bring it all together need to be well understood and communicated. Here’s Alan’s list of guiding principles (the number varies by speaker, apparently.)
- Focus on the user. This keeps you honest and provides you with a source of innovation. Users may not be articulate what they want but this, of course, is one of our jobs: working out what the user actually wants and working out how many users want a particular feature.
- Start with problems. Problems are a fantastic source of innovation. We want to be solving real, important and big problems. There are problems everywhere!
- Experiment Often. Try things, try a lot of things, work out what works, detect your failures and don’t expose your users to any more failures than you have to.
- Fail Fast. You need to be able to tolerate failure: it’s the flip side of failure. (A brief mention of Google Wave, *sniff*)
- Paying Attention to the Data. Listen to the data to find out what is and what is not working. Don’t survey, don’t hire marketing people, look at the data to find out what people are actually doing!
- Passion. Let engineers find their passion – people are always more productive when they can follow their passion. Google engineers can self-initiate a transfer to encourage them to follow their passion, and there is always the famous Google 20% time.
- Dogfood. Eat your own dogfood! Testing your own product in house and making sure that you want to use it is an essential step.
The Google approach to failure has benefited from the Silicon Valley origins of the company, with the approach to entrepreneurship and failure tolerance. Being associated with a failed start-up is not a bad thing: failure doesn’t have to be permanent. As long as you didn’t lie, cheat or steal, then you’ve gained experience. It’s not making the mistake, it’s how you recover from it and how you carry yourself through that process (hence being ethical even as the company is winding down).
To wind it all up, Google doesn’t have standard SE processes across the company: they focus on getting their organisation culture right with common principles that foster innovation. People want to do exciting things and follow new ideas so every team is empowered to make their own choices, select their own tools and processes. Launch, iterate, get it out, and don’t hold it back. Grow your software like a tree rather than dropping a monolith. Did it work? No? Wind it back. Yes? Build on it! Take the big bets sometimes because some big problems need big leaps forward: the moon shot is a part of the Google culture.
Embrace failure, learn from your mistakes and then move on.
Education and Paying Back (#AdelEd #CSER #DigitalTechnologies #acara #SAEdu)
Posted: March 22, 2014 Filed under: Education, Opinion | Tags: ACARA, advocacy, collaboration, community, cser, cser digital technologies, curriculum, design, digital education, digital technologies, education, educational problem, educational research, Generation Why, Google, higher education, learning, MOOC, Primary school, primary school teacher, principles of design, reflection, resources, school teachers, secondary school, sharing, teaching approaches, thinking, tools 2 CommentsOn Monday, the Computer Science Education Research Group and Google (oh, like you need a link) will release their open on-line course to support F-6 Primary school teachers in teaching the new Digital Technologies curriculum. We are still taking registrations so please go the course website if you want to sign up – or just have a look! (I’ve blogged about this recently as part of Science meets Parliament but you can catch it again here.) The course is open, on-line and free, released under Creative Commons so that the only thing people can’t do is to try and charge for it. We’re very excited and it’s so close to happening, I can taste it!
Here’s that link again – please, sign up!
I’m posting today for a few reasons. If you are a primary school teacher who wants help teaching digital technologies, we’d love to see you sign up and join our community of hundreds of other people who are thinking the same thing. If you know a primary school teacher, or are a principal for a primary school, and think that this would interest people – please pass it on! We are most definitely not trying to teach teachers how to teach (apart from anything else, what presumption!) but we’re hoping that what we provide will make it easier for teachers to feel comfortable, confident and happy with the new DT curriculum requirements which will lead to better experiences all ’round.
My other reason is one that came to me as I was recording my introduction section for the on-line course. In that brief “Oh, what a surprise there’s a camera” segment, I note that I consider the role of my teachers to have been essential in getting me to where I am today. This is what I’d like to do today: explicitly name and thank a few of my teachers and hope that some of what we release on Monday goes towards paying back into the general educational community.

You know who this is for.
My first thanks go to Mrs Shand from my Infant School in England. I was an early reader and, in an open plan classroom, she managed to keep me up with the other material while dealing with the fact that I was a voracious reader who would disappear to read at the drop of a hat. She helped to amplify my passion for reading, instead of trying to control it. Thank you!
In Australia, I ran into three people who were crucial to my development. Adam West was interested in everything so Grade 5 was full of computers (my first computing experience) because he arranged to borrow one and put it into the classroom in 1978, German (I can still speak the German I learnt in that class) and he also allowed us to write with nib and ink pens if we wanted – which was the sneakiest way to get someone’s handwriting and tidiness to improve that I have ever seen. Thank you, Adam! Mrs Lothian, the school librarian, also supported my reading habit and, after a while, all of the interesting books in the library often came through me very early on because I always returned them quickly and in good condition but this is where I was exposed to a whole world of interesting works: Nicholas Fisk, Ursula Le Guin and Susan Cooper not being the least of these. Thank you! Gloria Patullo (I hope I’ve spelt that correctly) was my Grade 7 teacher and she quickly worked out that I was a sneaky bugger on occasion and, without ever getting angry or raising a hand, managed to get me to realise that being clever didn’t mean that you could get away with everything and that being considerate and honest were the most important elements to alloy with smart. Thank you! (I was a pain for many years, dear reader, so this was a long process with much intervention.)
Moving to secondary school, I had a series of good teachers, all of whom tried to take the raw stuff of me and turn it into something that was happier, more useful and able to take that undirected energy in a more positive direction. I have to mention Ken Watson, Glenn Mulvihill, Mrs Batten, Dr Murray Thompson, Peter Thomas, Dr Riceman, Dr Bob Holloway, Milton Haseloff (I still have fossa, -ae, [f], ditch, burned into my brain) and, of course, Geoffrey Bean, headmaster, strong advocate of the thinking approaches of Edward de Bono and firm believer in the importance of the strength one needs to defend those who are less strong. Thank you all for what you have done, because it’s far too much to list here without killing the reader: the support, the encouragement, the guidance, the freedom to try things while still keeping a close eye, the exposure to thinking and, on occasion, the simple act of sitting me down to get me to think about what the heck I was doing and where I was going. The fact that I now work with some of them, in their continuing work in secondary education, is a wonderful thing and a reminder that I cannot have been that terrible. (Let’s just assume that, shall we? Moving on – rapidly…)
Of course, it’s not just the primary and secondary school teachers who helped me but they are the ones I want to concentrate on today, because I believe that the freedom and opportunities we offer at University are wonderful but I realise that they are not yet available to everyone and it is only by valuing, supporting and developing primary and secondary school education and the teachers who work so hard to provide it that we can go further in the University sector. We are lucky enough to be a juncture where dedicated work towards the national curriculum (and ACARA must be mentioned for all the hard work that they have done) has married up with an Industry partner who wants us all to “get” computing (Thank you, Google, and thank you so much, Sally and Alan) at a time when our research group was able to be involved. I’m a small part of a very big group of people who care about what happens in our schools and, if you have children of that age, you’ve picked a great time to send them to school. 🙂
I am delighted to have even a small opportunity to offer something back into a community which has given me so much. I hope that what we have done is useful and I can’t wait for it to start.
