
Designing a MOOC: how far did it reach? #csed
Posted: June 10, 2015 Filed under: Education, Opinion | Tags: advocacy, authenticity, blogging, collaboration, community, computer science education, constructivist, contributing student pedagogy, curriculum, data visualisation, design, education, educational problem, educational research, ethics, feedback, higher education, in the student's head, learning, measurement, MOOC, moocs, principles of design, reflection, resources, students, teaching, teaching approaches, thinking, tools Leave a commentMark Guzdial posted over on his blog on “Moving Beyond MOOCS: Could we move to understanding learning and teaching?” and discusses aspects (that still linger) of MOOC hype. (I’ve spoken about MOOCs done badly before, as well as recording the thoughts of people like Hugh Davis from Southampton.) One of Mark’s paragraphs reads:
“The value of being in the front row of a class is that you talk with the teacher. Getting physically closer to the lecturer doesn’t improve learning. Engagement improves learning. A MOOC puts everyone at the back of the class, listening only and doing the homework”
My reply to this was:
“You can probably guess that I have two responses here, the first is that the front row is not available to many in the real world in the first place, with the second being that, for far too many people, any seat in the classroom is better than none.
But I am involved in a, for us, large MOOC so my responses have to be regarded in that light. Thanks for the post!”
Mark, of course, called my bluff and responded with:
“Nick, I know that you know the literature in this space, and care about design and assessment. Can you say something about how you designed your MOOC to reach those who would not otherwise get access to formal educational opportunities? And since your MOOC has started, do you know yet if you achieved that goal — are you reaching people who would not otherwise get access?”
So here is that response. Thanks for the nudge, Mark! The answer is a bit long but please bear with me. We will be posting a longer summary after the course is completed, in a month or so. Consider this the unedited taster. I’m putting this here, early, prior to the detailed statistical work, so you can see where we are. All the numbers below are fresh off the system, to drive discussion and answering Mark’s question at, pretty much, a conceptual level.
First up, as some background for everyone, the MOOC team I’m working with is the University of Adelaide‘s Computer Science Education Research group, led by A/Prof Katrina Falkner, with me (Dr Nick Falkner), Dr Rebecca Vivian, and Dr Claudia Szabo.
I’ll start by noting that we’ve been working to solve the inherent scaling issues in the front of the classroom for some time. If I had a class of 12 then there’s no problem in engaging with everyone but I keep finding myself in rooms of 100+, which forces some people to sit away from me and also limits the number of meaningful interactions I can make to individuals in one setting. While I take Mark’s point about the front of the classroom, and the associated research is pretty solid on this, we encountered an inherent problem when we identified that students were better off down the front… and yet we kept teaching to rooms with more student than front. I’ll go out on a limb and say that this is actually a moral issue that we, as a sector, have had to look at and ignore in the face of constrained resources. The nature of large spaces and people, coupled with our inability to hover, means that we can either choose to have a row of students effectively in a semi-circle facing us, or we accept that after a relatively small number of students or number of rows, we have constructed a space that is inherently divided by privilege and will lead to disengagement.
So, Katrina’s and my first foray into this space was dealing with the problem in the physical lecture spaces that we had, with the 100+ classes that we had.
Katrina and I published a paper on “contributing student pedagogy” in Computer Science Education 22 (4), 2012, to identify ways for forming valued small collaboration groups as a way to promote engagement and drive skill development. Ultimately, by reducing the class to a smaller number of clusters and making those clusters pedagogically useful, I can then bring the ‘front of the class’-like experience to every group I speak to. We have given talks and applied sessions on this, including a special session at SIGCSE, because we think it’s a useful technique that reduces the amount of ‘front privilege’ while extending the amount of ‘front benefit’. (Read the paper for actual detail – I am skimping on summary here.)
We then got involved in the support of the national Digital Technologies curriculum for primary and middle school teachers across Australia, after being invited to produce a support MOOC (really a SPOC, small, private, on-line course) by Google. The target learners were teachers who were about to teach or who were teaching into, initially, Foundation to Year 6 and thus had degrees but potentially no experience in this area. (I’ve written about this before and you can find more detail on this here, where I also thanked my previous teachers!)
The motivation of this group of learners was different from a traditional MOOC because (a) everyone had both a degree and probable employment in the sector which reduced opportunistic registration to a large extent and (b) Australian teachers are required to have a certain number of professional development (PD) hours a year. Through a number of discussions across the key groups, we had our course recognised as PD and this meant that doing our course was considered to be valuable although almost all of the teachers we spoke to were furiously keen for this information anyway and my belief is that the PD was very much ‘icing’ rather than ‘cake’. (Thank you again to all of the teachers who have spent time taking our course – we really hope it’s been useful.)
To discuss access and reach, we can measure teachers who’ve taken the course (somewhere in the low thousands) and then estimate the number of students potentially assisted and that’s when it gets a little crazy, because that’s somewhere around 30-40,000.
In his talk at CSEDU 2014, Hugh Davis identified the student groups who get involved in MOOCs as follows. The majority of people undertaking MOOCs were life-long learners (older, degreed, M/F 50/50), people seeking skills via PD, and those with poor access to Higher Ed. There is also a small group who are Uni ‘tasters’ but very, very small. (I think we can agree that tasting a MOOC is not tasting a campus-based Uni experience. Less ivy, for starters.) The three approaches to the course once inside were auditing, completing and sampling, and it’s this final one that I want to emphasise because this brings us to one of the differences of MOOCs. We are not in control of when people decide that they are satisfied with the free education that they are accessing, unlike our strong gatekeeping on traditional courses.
I am in total agreement that a MOOC is not the same as a classroom but, also, that it is not the same as a traditional course, where we define how the student will achieve their goals and how they will know when they have completed. MOOCs function far more like many people’s experience of web browsing: they hunt for what they want and stop when they have it, thus the sampling engagement pattern above.
(As an aside, does this mean that a course that is perceived as ‘all back of class’ will rapidly be abandoned because it is distasteful? This makes the student-consumer a much more powerful player in their own educational market and is potentially worth remembering.)
Knowing these different approaches, we designed the individual subjects and overall program so that it was very much up to the participant how much they chose to take and individual modules were designed to be relatively self-contained, while fitting into a well-designed overall flow that built in terms of complexity and towards more abstract concepts. Thus, we supported auditing, completing and sampling, whereas our usual face-to-face (f2f) courses only support the first two in a way that we can measure.
As Hugh notes, and we agree through growing experience, marking/progress measures at scale are very difficult, especially when automated marking is not enough or not feasible. Based on our earlier work in contributing collaboration in the class room, for the F-6 Teacher MOOC we used a strong peer-assessment model where contributions and discussions were heavily linked. Because of the nature of the cohort, geographical and year-level groups formed who then conducted additional sessions and produced shared material at a slightly terrifying rate. We took the approach that we were not telling teachers how to teach but we were helping them to develop and share materials that would assist in their teaching. This reduced potential divisions and allows us to establish a mutually respectful relationship that facilitated openness.
(It’s worth noting that the courseware is creative commons, open and free. There are people reassembling the course for their specific take on the school system as we speak. We have a national curriculum but a state-focused approach to education, with public and many independent systems. Nobody makes any money out of providing this course to teachers and the material will always be free. Thank you again to Google for their ongoing support and funding!)
Overall, in this first F-6 MOOC, we had higher than usual retention of students and higher than usual participation, for the reasons I’ve outlined above. But this material was for curriculum support for teachers of young students, all of whom were pre-programming, and it could be contained in videos and on-line sharing of materials and discussion. We were also in the MOOC sweet-spot: existing degreed learners, PD driver, and their PD requirement depended on progressive demonstration on goal achievement, which we recognised post-course with a pre-approved certificate form. (Important note: if you are doing this, clear up how the PD requirements are met and how they need to be reported back, as early on as you can. It meant that we could give people something valuable in a short time.)
The programming MOOC, Think. Create. Code on EdX, was more challenging in many regards. We knew we were in a more difficult space and would be more in what I shall refer to as ‘the land of the average MOOC consumer’. No strong focus, no PD driver, no geographically guaranteed communities. We had to think carefully about what we considered to be useful interaction with the course material. What counted as success?
To start with, we took an image-based approach (I don’t think I need to provide supporting arguments for media-driven computing!) where students would produce images and, over time, refine their coding skills to produce and understand how to produce more complex images, building towards animation. People who have not had good access to education may not understand why we would use programming in more complex systems but our goal was to make images and that is a fairly universally understood idea, with a short production timeline and very clear indication of achievement: “Does it look like a face yet?”
In terms of useful interaction, if someone wrote a single program that drew a face, for the first time – then that’s valuable. If someone looked at someone else’s code and spotted a bug (however we wish to frame this), then that’s valuable. I think that someone writing a single line of correct code, where they understand everything that they write, is something that we can all consider to be valuable. Will it get you a degree? No. Will it be useful to you in later life? Well… maybe? (I would say ‘yes’ but that is a fervent hope rather than a fact.)
So our design brief was that it should be very easy to get into programming immediately, with an active and engaged approach, and that we have the same “mostly self-contained week” approach, with lots of good peer interaction and mutual evaluation to identify areas that needed work to allow us to build our knowledge together. (You know I may as well have ‘social constructivist’ tattooed on my head so this is strongly in keeping with my principles.) We wrote all of the materials from scratch, based on a 6-week program that we debated for some time. Materials consisted of short videos, additional material as short notes, participatory activities, quizzes and (we planned for) peer assessment (more on that later). You didn’t have to have been exposed to “the lecture” or even the advanced classroom to take the course. Any exposure to short videos or a web browser would be enough familiarity to go on with.
Our goal was to encourage as much engagement as possible, taking into account the fact that any number of students over 1,000 would be very hard to support individually, even with the 5-6 staff we had to help out. But we wanted students to be able to develop quickly, share quickly and, ultimately, comment back on each other’s work quickly. From a cognitive load perspective, it was crucial to keep the number of things that weren’t relevant to the task to a minimum, as we couldn’t assume any prior familiarity. This meant no installers, no linking, no loaders, no shenanigans. Write program, press play, get picture, share to gallery, winning.
As part of this, our support team (thanks, Jill!) developed a browser-based environment for Processing.js that integrated with a course gallery. Students could save their own work easily and share it trivially. Our early indications show that a lot of students jumped in and tried to do something straight away. (Processing is really good for getting something up, fast, as we know.) We spent a lot of time testing browsers, testing software, and writing code. All of the recorded materials used that development environment (this was important as Processing.js and Processing have some differences) and all of our videos show the environment in action. Again, as little extra cognitive load as possible – no implicit requirement for abstraction or skills transfer. (The AdelaideX team worked so hard to get us over the line – I think we may have eaten some of their brains to save those of our students. Thank you again to the University for selecting us and to Katy and the amazing team.)
The actual student group, about 20,000 people over 176 countries, did not have the “built-in” motivation of the previous group although they would all have their own levels of motivation. We used ‘meet and greet’ activities to drive some group formation (which worked to a degree) and we also had a very high level of staff monitoring of key question areas (which was noted by participants as being very high for EdX courses they’d taken), everyone putting in 30-60 minutes a day on rotation. But, as noted before, the biggest trick to getting everyone engaged at the large scale is to get everyone into groups where they have someone to talk to. This was supposed to be provided by a peer evaluation system that was initially part of the assessment package.
Sadly, the peer assessment system didn’t work as we wanted it to and we were worried that it would form a disincentive, rather than a supporting community, so we switched to a forum-based discussion of the works on the EdX discussion forum. At this point, a lack of integration between our own UoA programming system and gallery and the EdX discussion system allowed too much distance – the close binding we had in the R-6 MOOC wasn’t there. We’re still working on this because everything we know and all evidence we’ve collected before tells us that this is a vital part of the puzzle.
In terms of visible output, the amount of novel and amazing art work that has been generated has blown us all away. The degree of difference is huge: armed with approximately 5 statements, the number of different pieces you can produce is surprisingly large. Add in control statements and reputation? BOOM. Every student can write something that speaks to her or him and show it to other people, encouraging creativity and facilitating engagement.
From the stats side, I don’t have access to the raw stats, so it’s hard for me to give you a statistically sound answer as to who we have or have not reached. This is one of the things with working with a pre-existing platform and, yes, it bugs me a little because I can’t plot this against that unless someone has built it into the platform. But I think I can tell you some things.
I can tell you that roughly 2,000 students attempted quiz problems in the first week of the course and that over 4,000 watched a video in the first week – no real surprises, registrations are an indicator of interest, not a commitment. During that time, 7,000 students were active in the course in some way – including just writing code, discussing it and having fun in the gallery environment. (As it happens, we appear to be plateauing at about 3,000 active students but time will tell. We have a lot of post-course analysis to do.)
It’s a mistake to focus on the “drop” rates because the MOOC model is different. We have no idea if the people who left got what they wanted or not, or why they didn’t do anything. We may never know but we’ll dig into that later.
I can also tell you that only 57% of the students currently enrolled have declared themselves explicitly to be male and that is the most likely indicator that we are reaching students who might not usually be in a programming course, because that 43% of others, of whom 33% have self-identified as women, is far higher than we ever see in classes locally. If you want evidence of reach then it begins here, as part of the provision of an environment that is, apparently, more welcoming to ‘non-men’.
We have had a number of student comments that reflect positive reach and, while these are not statistically significant, I think that this also gives you support for the idea of additional reach. Students have been asking how they can save their code beyond the course and this is a good indicator: ownership and a desire to preserve something valuable.
For student comments, however, this is my favourite.
I’m no artist. I’m no computer programmer. But with this class, I see I can be both. #processingjs (Link to student’s work) #code101x .
That’s someone for whom this course had them in the right place in the classroom. After all of this is done, we’ll go looking to see how many more we can find.
I know this is long but I hope it answered your questions. We’re looking forward to doing a detailed write-up of everything after the course closes and we can look at everything.
EduTECH AU 2015, Day 1, Higher Ed Leaders, “Revolutionising the Student Experience: Thinking Boldly” #edutechau
Posted: June 2, 2015 Filed under: Education | Tags: AI, artificial intelligence, blogging, collaboration, community, data visualisation, deakin, design, education, educational research, edutech2015, edutecha, edutechau, ethics, higher education, learning, learning analytics, machine intelligence, measurement, principles of design, resources, student perspective, students, teaching, thinking, tools, training, watson Leave a commentLucy Schulz, Deakin University, came to speak about initiatives in place at Deakin, including the IBM Watson initiative, which is currently a world-first for a University. How can a University collaborate to achieve success on a project in a short time? (Lucy thinks that this is the more interesting question. It’s not about the tool, it’s how they got there.)
Some brief facts on Deakin: 50,000 students, 11,000 of whom are on-line. Deakin’s question: how can we make the on-line experience as good if not better than the face-to-face and how can on-line make face-to-face better?
Part of Deakin’s Student Experience focus was on delighting the student. I really like this. I made a comment recently that our learning technology design should be “Everything we do is valuable” and I realise now I should have added “and delightful!” The second part of the student strategy is for Deakin to be at the digital frontier, pushing on the leading edge. This includes understanding the drivers of change in the digital sphere: cultural, technological and social.
(An aside: I’m not a big fan of the term disruption. Disruption makes room for something but I’d rather talk about the something than the clearing. Personal bug, feel free to ignore.)
The Deakin Student Journey has a vision to bring students into the centre of Uni thinking, every level and facet – students can be successful and feel supported in everything that they do at Deakin. There is a Deakin personality, an aspirational set of “Brave, Stylish, Accessible, Inspiring and Savvy”.
Not feeling this as much but it’s hard to get a feel for something like this in 30 seconds so moving on.
What do students want in their learning? Easy to find and to use, it works and it’s personalised.
So, on to IBM’s Watson, the machine that won Jeopardy, thus reducing the set of games that humans can win against machines to Thumb Wars and Go. We then saw a video on Watson featuring a lot of keen students who coincidentally had a lot of nice things to say about Deakin and Watson. (Remember, I warned you earlier, I have a bit of a thing about shiny videos but ignore me, I’m a curmudgeon.)
The Watson software is embedded in a student portal that all students can access, which has required a great deal of investigation into how students communicate, structurally and semantically. This forms the questions and guides the answer. I was waiting to see how Watson was being used and it appears to be acting as a student advisor to improve student experience. (Need to look into this more once day is over.)
Ah, yes, it’s on a student home page where they can ask Watson questions about things of importance to students. It doesn’t appear that they are actually programming the underlying system. (I’m a Computer Scientist in a faculty of Engineering, I always want to get my hands metaphorically dirty, or as dirty as you can get with 0s and 1s.) From looking at the demoed screens, one of the shiny student descriptions of Watson as “Siri plus Google” looks very apt.
Oh, it has cheekiness built in. How delightful. (I have a boundless capacity for whimsy and play but an inbuilt resistance to forced humour and mugging, which is regrettably all that the machines are capable of at the moment. I should confess Siri also rubs me the wrong way when it tries to be funny as I have a good memory and the patterns are obvious after a while. I grew up making ELIZA say stupid things – don’t judge me! 🙂 )
Watson has answered 26,000 questions since February, with an 80% accuracy for answers. The most common questions change according to time of semester, which is a nice confirmation of existing data. Watson is still being trained, with two more releases planned for this year and then another project launched around course and career advisors.
What they’ve learned – three things!
- Student voice is essential and you have to understand it.
- Have to take advantage of collaboration and interdependencies with other Deakin initiatives.
- Gained a new perspective on developing and publishing content for students. Short. Clear. Concise.
The challenges of revolution? (Oh, they’re always there.) Trying to prevent students falling through the cracks and make sure that this tool help students feel valued and stay in contact. The introduction of new technologies have to be recognised in terms of what they change and what they improve.
Collaboration and engagement with your University and student community are essential!
Thanks for a great talk, Lucy. Be interesting to see what happens with Watson in the next generations.
EduTECH AU 2015, Day 1, Higher Ed Leaders, Panel Discussion “Leveraging data for strategic advantage” #edutechau
Posted: June 2, 2015 Filed under: Education | Tags: analytics, blogging, data analytics, education, educational problem, educational research, edutech2015, edutechau, ethics, higher education, learning analytics, measurement, principles of design, reflection, students, teaching, teaching approaches Leave a commentA most distinguished panel today. It can be hard to capture panel discussions so I will do what I can to get the pertinent points down. However, the fact that we are having this panel gives you some indication of the importance of this issue. Getting to know your data will make it easier for you to work out what to do in the future.
University of Wollongong (UoW) have set up a University-wide approach to Learning Analytics, with 30 courses in an early adopter program, scaling up over the next two years. Give things that they have learned.
- You need to have a very clear strategic approach for learning analytics. Learning analytics are built into key strategies. This ties in the key governing bodies and gives you the resources.
- Learning analytics need to be tied into IT and data management strategies – separating infrastructure and academics won’t work.
- The only driver for UoW is the academic driver, not data and not technology. All decisions are academic. “what is the value that this adds to maximums student learning, provide personalised learning and early identification of students at risk?”
- Governance is essential. UoW have a two-tier structure, a strategic group and an ethical use of data group. Both essential but separate.
- With data, and learning analytics, comes a responsibility for action. Actions by whom and, then, what action? What are the roles of the student, staff and support services? Once you have seen a problem that requires intervention, you are obliged to act.
I totally agree with this. I have had similar arguments on the important nature of 5.
The next speaker is from University of Melbourne (UoM), who wanted to discuss a high-level conceptual model. At the top of the model is the term ‘success’, a term that is not really understood or widely used, at national or local level. He introduced the term of ‘education analytics’ where we look at the overall identity of the student and interactions with the institution. We’re not having great conversations with students through written surveys so analytics can provide this information (a controversial approach). UoM want a new way, a decent way, to understand the student, rather than taking a simplistic approach. I think he mentioned intersectionality but not in a way that I really understood it.
Most of what determines student success in Australia isn’t academic, it’s personal, and we have to understand that. We also can’t depend on governments to move this, it will have to come out of the universities.
The next speaker is from University of Sydney, who had four points he wanted to make.
He started by talking about the potential of data. Data is there but it’s time to leverage it. Why are institutions not adopting LA as fast as they could? We understand the important of data-backed decision making.
Working with LA requires a very broad slice across the University – IT, BI, Academics, all could own it and they all want to control it. We want to collaborate so we need clear guidance and clear governance. Need to identify who is doing what without letting any one area steal it.
Over the last years, we have forgotten about the proximity of data. It’s all around us but many people think it’s not accessible. How do we get our hands on all of this data to make information-backed decisions in the right timeframe? This proximity applies to students as well, they should be able to see what’s going on as a day-by-day activity.
The final panellist is from Curtin University. Analytics have to be embedded into daily life and available with little effort if they’re going to be effective. At Curtin, analytics have a role in all places in the Uni, library, learning, life-long learning, you name it. Data has to be unified and available on demand. What do users want?
Curtin focused on creating demand – can they now meet that demand with training and staffing, to move to the next phase of attraction?
Need to be in a position of assisting everyone. This is a new world so have to be ready to help people quite a lot in the earlier stages. Is Higher Ed ready for the type of change that Amazon caused in the book market? Higher Ed can still have a role as validator of education but we have to learn to work with new approaches before our old market is torn out form underneath us.
We need to disentangle what the learner does from what the machine does.
That finished off the initial panel statements and then the chair moved to ask questions to the panel. I’ll try and summarise that.
One question was about the issue of security and privacy of student information. Can we take data that we used to help a student to complete their studies and then use that to try and recruit a new student, even anonymised? UoW mentioned that having a separate data ethics group for exactly this reason. UoW started this with a student survey, one question of which is “do you feel like this is Big Brother”. Fortunately, most felt that it wasn’t but they wanted to know what was going to happen with the data and the underlying driver had to be to help them to succeed.
Issuing a clear policy and embracing transparency is crucial here.
UoM made the point that much work is not built on a strong theoretical basis and a great deal of it is measuring what we already think we care about. There is a lot of value in clearly identifying what works and what doesn’t.
That’s about it for this session. Again, so much to think about.
EduTech Australia 2015, Day 1, Session 2, Higher Education IT Leaders #edutechau
Posted: June 2, 2015 Filed under: Education | Tags: blogging, community, customer-centric, design, digital technologies, education, educational research, edutech2015, edutechau, higher education, learning technologies, mark gregory, measurement, principles of design, resources, technology services, the university of adelaide, tools, University of Adelaide Leave a commentI jumped streams (GASP) to attend Mark Gregory’s talk on “Building customer-centric IT services.” Mark is the CIO from my home institutions, the University of Adelaide, and I work closely with him on a couple of projects. There’s an old saying that if you really want to know what’s going on in your IT branch, go and watch the CIO give a presentation away from home, which may also explain why I’m here. (Yes, I’m a dreadful cynic.)
Seven years ago, we had the worst customer-centric IT ratings in Australia and New Zealand, now we have some of the highest. That’s pretty impressive and, for what it’s worth, it reflects my experiences inside the institution.
Mark showed a picture of the ENIAC team, noting that the picture had been mocked up a bit, as additional men had been staged in the picture, which was a bit strange even the ENIAC team were six women to one man. (Yes, this has been going on for a long time.) His point was that we’ve come a long way from he computer attended by acolytes as a central resource to computers everywhere that everyone can access and we have specifically chosen. Technology is now something that you choose rather than what you put up with.
For Adelaide, on a typical day we see about 56,000 devices on the campus networks, only a quarter of which are University-provided. Over time, the customer requirement for centralised skills is shrinking as their own skills and the availability of outside (often cloud-based) resources increase. In 2020-2025, fewer and fewer of people on campus will need centralised IT.
Is ERP important? Mark thinks ‘Meh’ because it’s being skinned with Apps and websites, the actual ERP running in the background. What about networks? Well, everyone’s got them. What about security? That’s more of an imposition and it’s used by design issues. Security requirements are not a crowd pleaser.
So how will our IT services change over time?
A lot of us are moving from SOE to BYOD but this means saying farewell to the Standard Operating Environment (SOE). It’s really not desirable to be in this role, but it also drives a new financial model. We see 56,000 devices for 25,000 people – the mobility ship has sailed. How will we deal with it?
We’re moving from a portal model to an app model. The one stop shop is going and the new model is the build-it-yourself app store model where every device is effectively customised. The new user will not hang out in the portal environment.
Mark thinks we really, really need to increase the level of Self Help. A year ago, he put up 16 pages of PDFs and discovered that, over the year, 35,000 people went through self help compared to 70,000 on traditional help-desk. (I question that the average person in the street knows that an IP address given most of what I see in movies. 😉 )
The newer operating systems require less help but student self-help use is outnumbered 5 times by staff usage. Students go somewhere else to get help. Interesting. Our approaches to VPN have to change – it’s not like your bank requires one. Our approaches to support have to change – students and staff work 24×7, so why were we only supporting them 8-6? Adelaide now has a contract service outside of those hours to take the 100 important calls that would have been terrible had they not been fixed.
Mark thinks that IDM and access need to be fixed, it makes up 24% of their reported problems: password broken, I can’t get on and so on.
Security used to be on the device that the Uni owned. This has changed. Now it has to be data security, as you can’t guarantee that you own the device. Virtual desktops and virtual apps can offer data containerisation among their other benefits.
Let’s change the thinking from setting a perimeter to the person themselves. The boundaries are shifting and, let’s be honest, the inside of any network with 30,000 people is going to be swampy anyway.
Project management thinking is shifting from traditional to agile, which gets closer to the customer on shorter and smaller projects. But you have to change how you think about projects.
A lot of tools used to get built that worked with data but now people want to make this part of their decision infrastructure. Data quality is now very important.
The massive shift is from “provide and control” to “advise and enable”. (Sorry, auditors.) Another massive shift is from automation of a process that existed to support a business to help in designing the processes that will support the business. This is a driver back into policy space. (Sorry, central admin branch.) At the same time, Mark believes that they’re transitioning from a functional approach to a customer-centric focus. A common services layer will serve the student, L&T, research and admin groups but those common services may not be developed or even hosted inside the institution.
It’s not a surprise to anyone who’s been following what Mark has been doing, but he believes that the role is shifting from IT operations to University strategy.
Some customers are going to struggle. Some people will always need help. But what about those highly capable individuals who could help you? This is where innovation and co-creation can take place, with specific people across the University.
Mark wants Uni IT organisations to disrupt themselves. (The Go8 are rather conservative and are not prone to discussing disruption, let alone disrupting.)
Basically, if customers can do it, make themselves happy and get what they want working, why are you in their way? If they can do it themselves, then get out of the way except for those things where you add value and make the experience better. We’re helping people who are desperate but we’re not putting as much effort into the innovators and more radical thinkers. Mark’s belief is that investing more effort into collaboration, co-creation and innovation is the way to go.
It looks risky but is it? What happens if you put technology out there? How do you get things happening?
Mark wants us to move beyond Service Level Agreements, which he describes as the bottom bar. No great athlete performs at the top level because of an SLA. This requires a move to meaningful metrics. (Very similar to student assessment, of course! Same problem!) Just because we measure something doesn’t make it meaningful!
We tended to hire skills to provide IT support. Mark believes that we should now be hiring attributes: leaders, drivers, innovators. The customer wants to get somewhere. How can we help them?
Lots to think about – thanks, Mark!
EduTech Australia 2015, Day 1, Session 1, Higher Education Leaders @jselingo #edutechau
Posted: June 2, 2015 Filed under: Education, Opinion | Tags: advocacy, blogging, education, educational research, edutech2015, edutechau, higher education, Jeffrey Selingo, learning, students, teaching, teaching approaches, thinking, tools, workload Leave a commentEmeritus Professor Steven Schwartz, AM, opened the Higher Ed leaders session, following a very punchy video on how digital is doing “zoom” and “rock and roll” things. (I’m a bit jaded about “tech wow” videos but this one was pretty good. It reinforced the fact that over 60% of all web browsing is carried out on mobile devices, which should be a nudge to all of us designing for the web.)
There will be roughly 5,000 participants in the totally monstrous Brisbane Convention Centre. There are many people here that I know but I’m beginning to doubt whether I’m going to see many of them unless they’re speaking – there’s a mass of educational humanity here, people!
The opening talk was “The Universities of tomorrow, the future of anytime and anywhere learning”, presented by Jeffrey Selingo. Jeff writes books, “College Unbound” among others, and is regular contributor to the Washington Post and the Chronicle. (I live for the day I can put “Education Visionary” on my slides with even a shred of this credibility. As a note, remarks in parentheses are probably my editorial comments.)
(I’ve linked to Jeff on Twitter. Please correct me on anything, Jeff!)
Jeff sought out to explore the future of higher learning, taking time out from editing the Chronicle. He wanted to tell the story of higher ed for the coming decade, for those parents and students heading towards it now, rather than being in it now. Jeff approached it as a report, rather than an academic paper, and is very open about the fact that he’s not conducting research. “In journalism, if you have three anecdotes, you have a trend.”
(I’m tempted to claim phenomenography but I know you’ll howl me down. And rightly so!)
Higher Ed is something that, now, you encounter once in our lives and then move on. But the growth in knowledge and ongoing explosion of new information doesn’t match that model. Our Higher Ed model is based on an older tradition and and older informational model.
(This is great news for me, I’m a strong advocate of an integrated and lifelong Higher Ed experience)
(Slides for this talk available at http://jeffselingo.com/conference
Be warned, you have to sign up for a newsletter to get the slides.)
Jeff then talked about his start, in one of the initial US college rankings, before we all ranked each other into the ground. The ‘prestige race’ as he refers to it. Every university around the world wanted to move up the ladder. (Except for the ones on the top, kicking at the rungs below, no doubt.)
“Prestige is to higher education as profit is to corporations.”
According to Caroline Hoxby, Higher Ed student flow has increased as students move around the world. Students who can move to different Universities, now tend to do so and they can exercise choices around the world. This leads to predictions like “the bottom 25% of Unis will go out of business or merge” (Clay Christensen) – Jeff disagrees with this although he thinks change is inevitable.
We have a model of new, technologically innovative and agile companies destroy the old leaders. Netflix ate Blockbuster. Amazon ate Borders. Apple ate… well, everybody… but let’s say Tower Records, shall we? Jeff noted that journalism’s upheaval has been phenomenal, despite the view of journalism as a ‘public trust’. People didn’t want to believe what was going to happen to their industry.
Jeff believes that students are going to drive the change. He believes that students are often labelled as “Traditional” (ex-school, 18-22, direct entry) and “non-Traditional” (adult learners, didn’t enter directly.) But what this doesn’t capture is the mindset or motivation of students to go to college. (MOOC motivation issues, anyone?)
What do students want to get out of their degree?
(Don’t ask difficult questions like that, Jeff! It is, of course, a great question and one we try to ask but I’m not sure we always listen.)
Why are you going? What do you want? What do you want your degree to look like? Jeff asked and got six ‘buckets’ of students in two groups, split across the trad/non-trad age groups.
Group 1 are the younger group and they break down into.
- Young Academics (24%) – the trad high-performing students who have mastered the earlier education systems and usually have a privileged background
- Coming of Age (11%) – Don’t quite know what they want from Uni but they were going to college because it was the place to go to become an adult. This is getting them ready to go to the next step, the work force.
- Career Starters (18%) – Students who see the Uni as a means to the end, credentialing for the job that they want. Get through Uni as quickly as possible.
Group 2 are older:
- Career Accelerators (21%) – Older students who are looking to get new credentials to advance themselves in their current field.
- Industry Switchers – Credential changers to move to a new industry.
- Adult Wanderers – needed a degree because that was what the market told them but they weren’t sure why
(Apologies for losing some of the stats, the room’s quite full and some people had to walk past me.)
But that’s what students are doing – what skills are required out there from the employers?
- Written and Oral communication
- Managing multiple priorities
- Collaboration
- Problem solving
People used to go to college for a broad knowledge base and then have that honed by an employer or graduate school to focus them into a discipline. Now, both of these are expected at the Undergrad level, which is fascinating given that we don’t have extra years to add to the degree. But we’re not preparing students better to enter college, nor do we have the space for experiential learning.
Expectations are greater than ever but are we delivering?
When do we need higher education? Well, it used to be “education” then “employment” then “retirement”. The new model, today, (from Georgetown, Tony Carnevale), we have “education”, then “learning and earning”, then “full-time work and on-the-job training”, “transition to retirement” and, finally, “full retirement”. Students are finally focusing on their career at around 30, after leaving the previous learning phases. This is, Jeff believes, where we are not playing an important role for students in their 20s, which is not helping them in their failure to launch.
Jeff was wondering how different life would be for the future, especially given how much longer we are going to be living. How does that Uni experience of “once in our lives, in one physical place” fit in, if people may switch jobs much more frequently over a longer life? The average person apparently switches jobs every four years – no wonder most of the software systems I use are so bad!
Je”s “College Unbound” future is student-driven, student-centred, and not a box that is entered at 18 and existed 4 years later, it’s a platform for life-long learning.
“The illiterate will be those who cannot learn, unlearn and relearn” – Alvin Toffler
Jeff doesn’t think that there will be one simple path to the future. Our single playing field competition of institutions has made us highly similar in the higher ed sector. How can we personalise pathways to the different groups of students that we saw above? Predictive analytics are important here – technology is vital. Good future education will be adaptive and experiential, combining the trad classroom with online systems. apprenticeships and, overall, removing the requirement to reside at or near your college.
Jeff talked about some new models, starting with the Swirl, the unbundled degree across different institutions, traditional snd not. Multiple universities, multiple experiences = degree.
Then there’s mixing course types, mixing face-to-face with hybrid and online to accelerate their speed of graduation. (There is a strong philosophical point on this that I hope to get back to later: why are we racing through University?)
Finally, competency-based learning allowed a learner to have class lengths from 2 weeks to 14 weeks, based on what she already knew. (I am a really serious advocate of this approach. I advocated to switch our entire first year for Engineering to a competency based approach but I’ll write more about that later on. And, no, we didn’t do it but at least we thought about it.)
In the mix are smaller chunks of information and just-in-time learning. Anyone who has used YouTube for a Photoshop tutorial has had a positive (well, as positive as it can be) experience with this. Why can’t we do this with any number of higher ed courses?
A note on the Stanford 2025 Design School exercise: the open loop education. Accepted to Stanford would give you access to 6 years of education that you would be able to use at any point in your life. Take two years, go out and work a bit, come back. Why isn’t the University at the centre of our lifelong involvement with learning?
The distance between producer and consumer is shrinking, whether it’s online stores or 3-D printing. Example given was MarginalRevolutionUniversity, a homegrown University, developed by a former George Mason academic.
As aways, the MOOC dropout rate was raised. Yes, only 10% complete, but Jeff’s interviews confirm what we already know, most of those students had no intention of completing. They didn’t think of the MOOC course as a course or as part of a degree, they were dipping in to get what they needed, when they needed it. Just like those YouTube Photoshop tutorials.
The difficult question is how certify this. And… here are badges again, part of certification of learning and the challenge is how we use them.
Jeff think that there are still benefits for residential experience, although assisted and augmented with technology:
- Faculty mentoring
- Undergraduate research (team work, open problems)
- Be creative. Take Risks. Learn how to fail.
- Cross-cultural experience.
Of course, not all of this is available to everyone. And what is the return on investment for this? LinkedIn finally has enough data that we can start to answer that question. (People will tell LinkedIn things that they won’t tell other people, apparently.) This may change the ranking game because rankings can now be conducted on outputs rather than inputs. Watch this space?
The world is changing. What does Jeff think? Ranking is going to change and we need to be able to prove our value. We have to move beyond isolated disciplines. Skill certification is going to get harder but the overall result should be better. University is for life, not just for three years. This will require us to build deep academic alliances that go beyond our traditional boxes.
Ok, prepping for the next talk!
The driverless car is more than transportation technology.
Posted: May 4, 2015 Filed under: Education, Opinion | Tags: AI, blogging, community, data visualisation, driverless car, driverless cars, education, educational problem, Elon Musk, higher education, in the student's head, measurement, principles of design, robots, teaching, teaching approaches, thinking, universal principles of design 1 CommentI’m hoping to write a few pieces on design in the coming days. I’ll warn you now that one of them will be about toilets, so … urm … prepare yourself, I guess? Anyway, back to today’s theme: the driverless car. I wanted to talk about it because it’s a great example of what technology could do, not in terms of just doing something useful but in terms of changing how we think. I’m going to look at some of the changes that might happen. No doubt many of you will have ideas and some of you will disagree so I’ll wait to see what shows up in the comments.
Humans have been around for quite a long time but, surprisingly given how prominent they are in our lives, cars have only been around for 120 years in the form that we know them – gasoline/diesel engines, suspension and smaller-than-buggy wheels. And yet our lives are, in many ways, built around them. Our cities bend and stretch in strange ways to accommodate roads, tunnels, overpasses and underpasses. Ask anyone who has driven through Atlanta, Georgia, where an Interstate of near-infinite width can be found running from Peachtree & Peachtree to Peachtree, Peachtree, Peachtree and beyond!
But what do we think of when we think of cars? We think of transportation. We think of going where we want, when we want. We think of using technology to compress travel time and this, for me, is a classic human technological perspective because we are love to amplify. Cars make us faster. Computers allow us to add up faster. Guns help us to kill better.
So let’s say we get driverless cars and, over time, the majority of cars on the road are driverless. What does this mean? Well, if you look at road safety stats and the WHO reports, you’ll see that about up 40% of traffic fatalities can be straight line accidents (these figures from the Victorian roads department, 2006-2013). That is, people just drive off a straight road and kill themselves. The leading killers overall are alcohol, fatigue, and speed. Driverless cars will, in one go, remove all of these. Worldwide, a million people per year just stopped dying.
But it’s not just transportation. In America, commuting to work eats up from 35-65 hours of your year. If you live in DC, you spend two weeks every year cursing the Beltway. And it’s not as if you can easily work in your car so those are lost hours. That’s not enjoyable driving! That’s hours of frustration, wasted fuel, exposure to burning fuel, extra hours you have to work. The fantasy of the car is driving a convertible down the Interstate in the sunshine, listening to rock, and singing along. The reality is inching forward with the windows up in a 10 year old Nissan family car while stuck between FM stations and having to listen to your second iPod because the first one’s out of power. And it’s the joke one that only has Weird Al on it.
Enter the driverless car. Now you can do some work but there’s no way that your commute will be as bad anyway because we can start to do away with traffic lights and keep the traffic moving. You’ll be there for less time but you can do more. Have a sleep if you want. Learn a language. Do a MOOC! Winning!
Why do I think it will be faster? Every traffic light has a period during which no-one is moving. Why? Because humans need clear signals and need to know what other drivers are doing. A driverless car can talk to other cars and they can weave in and out of the traffic signals. Many traffic jams are caused by people hitting the brakes and then people arrive at this braking point faster than people are leaving. There is no need for this traffic jam and, with driverless cars, keeping distance and speed under control is far easier. Right now, cars move like ice through a vending machine. We want them to move like water.
How will you work in your car? Why not make every driverless car a wireless access point using mesh networking? Now the more cars you get together, the faster you can all work. The I495 Beltway suddenly becomes a hub of activity rather than a nightmare of frustration. (In a perfect world, aliens come to Earth and take away I495 as their new emperor, leaving us with matter transporters, but I digress.)
But let’s go further. Driverless cars can have package drops in them. The car that picks you up from work has your Amazon parcels in the back. It takes meals to people who can’t get out. It moves books around.
But let’s go further. Make them electric and put some of Elon’s amazing power cells into them and suddenly we have a power transportation system if we can manage the rapid charge/discharge issues. Your car parks in the city turn into repair and recharge facilities for fleets of driverless cars, charging from the roof solar and wind, but if there’s a power problem, you can send 1000 cars to plug into the local grid and provide emergency power.
We still need to work out some key issues of integration: cyclists, existing non-converted cars and pedestrians are the first ones that come to mind. But, in my research group, we have already developed passive localisation that works on a scale that could easily be put onto cars so you know when someone is among the cars. Combine that with existing sensors and all a cyclist has to do is to wear a sensor (non-personalised, general scale and anonymised) that lets intersections know that she is approaching and the cars can accommodate it. Pedestrians are slow enough that cars can move around them. We know that they can because slow humans do it often enough!
We start from ‘what could we do if we produced a driverless car’ and suddenly we have free time, increased efficiency and the capacity to do many amazing things.
Now, there are going to be protests. There are going to be people demanding their right to drive on the road and who will claim that driverless cars are dangerous. There will be anti-robot protests. There already have been. I expect that the more … freedom-loving states will blow up a few of these cars to make a point. Anyone remember the guy waving a red flag who had to precede every automobile? It’s happened before. It will happen again.
We have to accept that there are going to be deaths related to this technology, even if we plan really hard for it not to happen, and it may be because of the technology or it may be because of opposing human action. But cars are already killing so may people. 1.2 million people died on the road in 2010, 36,000 from America. We have to be ready for the fact that driverless cars are a stepping stone to getting people out of the grind of the commute and making much better use of our cities and road spaces. Once we go driverless we need to look at how many road accidents aren’t happening, and address the issues that still cause accidents in a driverless example.
Understand the problem. Measure what’s happening. Make a change. Measure again. Determine the impact.
When we think about keeping the manually driven cars on the road, we do have a precedent. If you look at air traffic, the NTSB Accidents and Accident Rates by NTSB Classification 1998-2007 report tells us that the most dangerous type of flying is small private planes, which are more than 5 times more likely to have an accident than commercial airliners. Maybe it will be the insurance rates or the training required that will reduce the private fleet? Maybe they’ll have overrides. We have to think about this.
It would be tempting to say “why still have cars” were it not for the increasingly ageing community, those people who have several children and those people who have restricted mobility, because they can’t just necessarily hop on a bike or walk. As someone who has had multiple knee surgeries, I can assure you that 100m is an insurmountable distance sometimes – and I used to run 45km up and down mountains. But what we can do is to design cities that work for people and accommodate the new driverless cars, which we can use in a much quieter, efficient and controlled manner.
Vehicles and people can work together. The Denver area, Bahnhofstrasse in Zurich and Bourke Street Mall in Melbourne are three simple examples where electric trams move through busy pedestrian areas. Driverless cars work like trams – or they can. Predictable, zoned and controlled. Better still, for cyclists, driverless cars can accommodate sharing the road much more easily although, as noted, there may still be some issues for traffic control that will need to be ironed out.
It’s easy to look at the driverless car as just a car but this is missing all of the other things we could be doing. This is just one example where the replacement of something ubiquitous that might just change the world for the better.
Think. Create. Code. Vis! (@edXOnline, @UniofAdelaide, @cserAdelaide, @code101x, #code101x)
Posted: April 30, 2015 Filed under: Education, Opinion | Tags: #code101x, advocacy, blogging, collaboration, community, curriculum, data visualisation, education, educational problem, educational research, edx, higher education, learning, measurement, MOOC, moocs, reflection, resources, teaching, teaching approaches, thinking, tools, universal principles of design Leave a commentI just posted about the massive growth in our new on-line introductory programming course but let’s look at the numbers so we can work out what’s going on and, maybe, what led to that level of success. (Spoilers: central support from EdX helped a huge amount.) So let’s get to the data!
I love visualised data so let’s look at the growth in enrolments over time – this is really simple graphical stuff as we’re spending time getting ready for the course at the moment! We’ve had great support from the EdX team through mail-outs and Twitter and you can see these in the ‘jumps’ in the data that occurred at the beginning, halfway through April and again at the end. Or can you?

Rapid growth in enrolment! But it’s a little hard to see in this data.
Hmm, this is a large number, so it’s not all that easy to see the detail at the end. Let’s zoom in and change the layout of the data over to steps so we can things more easily. (It’s worth noting that I’m using the free R statistical package to do all of this. I can change one line in my R program and regenerate all of my graphs and check my analysis. When you can program, you can really save time on things like this by using tools like R.)

Now you can see where that increase started and then the big jump around the time that e-mail advertising started, circled. That large spike at the end is around 1500 students, which means that we jumped 10% in a day.
When we started looking at this data, we wanted to get a feeling for how many students we might get. This is another common use of analysis – trying to work out what is going to happen based on what has already happened.
As a quick overview, we tried to predict the future based on three different assumptions:
- that the growth from day to day would be roughly the same, which is assuming linear growth.
- that the growth would increase more quickly, with the amount of increase doubling every day (this isn’t the same as the total number of students doubling every day).
- that the growth would increase even more quickly than that, although not as quickly as if the number of students were doubling every day.
If Assumption 1 was correct, then we would expect the graph to look like a straight line, rising diagonally. It’s not. (As it is, this model predicted that we would only get 11,780 students. We crossed that line about 2 weeks ago.
So we know that our model must take into account the faster growth, but those leaps in the data are changes that caused by things outside of our control – EdX sending out a mail message appears to cause a jump that’s roughly 800-1,600 students, and it persists for a couple of days.
Let’s look at what the models predicted. Assumption 2 predicted a final student number around 15,680. Uhh. No. Assumption 3 predicted a final student number around 17,000, with an upper bound of 17,730.
Hmm. Interesting. We’ve just hit 17,571 so it looks like all of our measures need to take into account the “EdX” boost. But, as estimates go, Assumption 3 gave us a workable ballpark and we’ll probably use it again for the next time that we do this.
Now let’s look at demographic data. We now we have 171-172 countries (it varies a little) but how are we going for participation across gender, age and degree status? Giving this information to EdX is totally voluntary but, as long as we take that into account, we make some interesting discoveries.
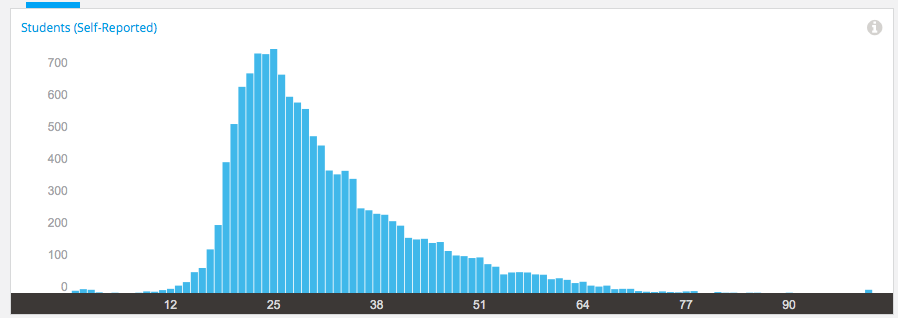
Age demographic data from EdX
Our median student age is 25, with roughly 40% under 25 and roughly 40% from 26 to 40. That means roughly 20% are 41 or over. (It’s not surprising that the graph sits to one side like that. If the left tail was the same size as the right tail, we’d be dealing with people who were -50.)
The gender data is a bit harder to display because we have four categories: male, female, other and not saying. In terms of female representation, we have 34% of students who have defined their gender as female. If we look at the declared male numbers, we see that 58% of students have declared themselves to be male. Taking into account all categories, this means that our female participant percentage could be as high as 40% but is at least 34%. That’s much higher than usual participation rates in face-to-face Computer Science and is really good news in terms of getting programming knowledge out there.
We’re currently analysing our growth by all of these groupings to work out which approach is the best for which group. Do people prefer Twitter, mail-out, community linkage or what when it comes to getting them into the course.
Anyway, lots more to think about and many more posts to come. But we’re on and going. Come and join us!
Think. Create. Code. Wow! (@edXOnline, @UniofAdelaide, @cserAdelaide, @code101x, #code101x)
Posted: April 30, 2015 Filed under: Education, Opinion | Tags: #code101x, advocacy, authenticity, blogging, community, cser digital technologies, curriculum, digital technologies, education, educational problem, educational research, ethics, higher education, Hugh Davis, learning, MOOC, moocs, on-line learning, research, Southampton, student perspective, teaching, teaching approaches, thinking, tools, University of Southampton 1 Comment
Screenshot of our EdX page. Shiny!
Things are really exciting here because, after the success of our F-6 on-line course to support teachers for digital technologies, the Computer Science Education Research group are launching their first massive open on-line course (MOOC) through AdelaideX, the partnership between the University of Adelaide and EdX. (We’re also about to launch our new 7-8 course for teachers – watch this space!)
Our EdX course is called “Think. Create. Code.” and it’s open right now for Week 0, although the first week of real content doesn’t go live until the 30th. If you’re not already connected with us, you can also follow us on Facebook (code101x) or Twitter (@code101x), or search for the hashtag #code101x. (Yes, we like to be consistent.)
I am slightly stunned to report that, less than 24 hours before the first content starts to roll out, that we have 17,531 students enrolled, across 172 countries. Not only that, but when we look at gender breakdown, we have somewhere between 34-42% women (not everyone chooses to declare a gender). For an area that struggles with female participation, this is great news.
I’ll save the visualisation data for another post, so let’s quickly talk about the MOOC itself. We’re taking a 6 week approach, where students focus on developing artwork and animation using the Processing language, but it requires no prior knowledge and runs inside a browser. The interface that has been developed by the local Adelaide team (thank you for all of your hard work!) is outstanding and it’s really easy to make things happen.
I love this! One of the biggest obstacles to coding is having to wait until you see what happens and this can lead to frustration and bad habits. In Processing you can have a circle on the screen in a matter of seconds and you can start playing with colour in the next second. There’s a lot going on behind the screen to make it this easy but the student doesn’t need to know it and can get down to learning. Excellent!
I went to a great talk at CSEDU last year, presented by Hugh Davis from Southampton, where Hugh raised some great issues about how MOOCs compared to traditional approaches. I’m pleased to say that our demography is far more widespread than what was reported there. Although the US dominates, we have large representations from India, Asia, Europe and South America, with a lot of interest from Africa. We do have a lot of students with prior degrees but we also have a lot of students who are at school or who aren’t at University yet. It looks like the demography of our programming course is much closer to the democratic promise of free on-line education but we’ll have to see how that all translates into participation and future study.
While this is an amazing start, the whole team is thinking of this as part of a project that will be going on for years, if not decades.
When it came to our teaching approach, we spent a lot of time talking (and learning from other people and our previous attempts) about the pedagogy of this course: what was our methodology going to be, how would we implement this and how would we make it the best fit for this approach? Hugh raised questions about the requirement for pedagogical innovation and we think we’ve addressed this here through careful customisation and construction (we are working within a well-defined platform so that has a great deal of influence and assistance).
We’ve already got support roles allocated to staff and students will see us on the course, in the forums, and helping out. One of the reasons that we tried to look into the future for student numbers was to work out how we would support students at this scale!
One of our most important things to remember is that completion may not mean anything in the on-line format. Someone comes on and gets an answer to the most pressing question that is holding them back from coding, but in the first week? That’s great. That’s success! How we measure that, and turn that into traditional numbers that match what we do in face-to-face, is going to be something we deal with as we get more information.
The whole team is raring to go and the launch point is so close. We’re looking forward to working with thousands of students, all over the world, for the next six weeks.
Sound interesting? Come and join us!
Musing on Industrial Time
Posted: April 20, 2015 Filed under: Education, Opinion | Tags: advocacy, authenticity, blogging, community, curriculum, design, education, educational problem, educational research, ethics, higher education, in the student's head, learning, measurement, principles of design, reflection, resources, student perspective, teaching, teaching approaches, thinking, time banking, universal principles of design, work/life balance, workload 3 Comments
I caught up with a good friend recently and we were discussing the nature of time. She had stepped back from her job and was now spending a lot of her time with her new-born son. I have gone to working three days a week, hence have also stepped back from the five-day grind. It was interesting to talk about how this change to our routines had changed the way that we thought of and used time. She used a term that I wanted to discuss here, which was industrial time, to describe the clock-watching time of the full-time worker. This is part of the larger area of time discipline, how our society reacts to and uses time, and is really quite interesting. Both of us had stopped worrying about the flow of time in measurable hours on certain days and we just did things until we ran out of day. This is a very different activity from the usual “do X now, do Y in 15 minutes time” that often consumes us. In my case, it took me about three months of considered thought and re-training to break the time discipline habits of thirty years. In her case, she has a small child to help her to refocus her time sense on the now.
Modern time-sense is so pervasive that we often don’t think about some of the underpinnings of our society. It is easy to understand why we have years and, although they don’t line up properly, months given that these can be matched to astronomical phenomena that have an effect on our world (seasons and tides, length of day and moonlight, to list a few). Days are simple because that’s one light/dark cycle. But why there are 52 weeks in a year? Why are there 7 days in a week? Why did the 5-day week emerge as a contiguous block of 5 days? What is so special about working 9am to 5pm?
A lot of modern time descends from the struggle of radicals and unionists to protect workers from the excesses of labour, to stop people being worked to death, and the notion of the 8 hour day is an understandable division of a 24 hour day into three even chunks for work, rest and leisure. (Goodness, I sound like I’m trying to sell you chocolate!)
If we start to look, it turns out that the 7 day week is there because it’s there, based on religion and tradition. Interestingly enough, there have been experiments with other week lengths but it appears hard to shift people who are used to a certain routine and, tellingly, making people wait longer for days off appears to be detrimental to adoption.
If we look at seasons and agriculture, then there is a time to sow, to grow, to harvest and to clear, much as there is a time for livestock to breed and to be raised for purpose. If we look to the changing time of sunrise and sunset, there is a time at which natural light is available and when it is not. But, from a time discipline perspective, these time systems are not enough to be able to build a large-scale, industrial and synchronised society upon – we must replace a distributed, loose and collective notion of what time is with one that is centralised, authoritarian and singular. While religious ceremonies linked to seasonal and astronomical events did provide time-keeping on a large scale prior to the industrial revolution, the requirement for precise time, of an accuracy to hours and minutes, was not possible and, generally, not required beyond those cues given from nature such as dawn, noon, dusk and so on.
After the industrial revolution, industries and work was further developed that was heavily separated from a natural linkage – there are no seasons for a coal mine or a steam engine – and the development of the clock and reinforcement of the calendar of work allowed both the measurement of working hours (for payment) and the determination of deadlines, given that natural forces did not have to be considered to the same degree. Steam engines are completed, they have no need to ripen.
With the notion of fixed and named hours, we can very easily determine if someone is late when we have enough tools for measuring the flow of time. But this is, very much, the notion of the time that we use in order to determine when a task must be completed, rather than taking an approach that accepts that the task will be completed at some point within a more general span of time.
We still have confusion where our understanding of “real measures” such as days, interact with time discipline. Is midnight on the 3rd of April the second after the last moment of April the 2nd or the second before the first moment of April the 4th? Is midnight 12:00pm or 12:00am? (There are well-defined answers to this but the nature of the intersection is such that definitions have to be made.)
But let’s look at teaching for a moment. One of the great criticisms of educational assessment is that we confuse timeliness, and in this case we specifically mean an adherence to meeting time discipline deadlines, with achievement. Completing the work a crucial hour after it is due can lead to that work potentially not being marked at all, or being rejected. But we do usually have over-riding reasons for doing this but, sadly, these reasons are as artificial as the deadlines we impose. Why is an Engineering Degree a four-year degree? If we changed it to six would we get better engineers? If we switched to competency based training, modular learning and life-long learning, would we get more people who were qualified or experienced with engineering? Would we get less? What would happen if we switched to a 3/1/2/1 working week? Would things be better or worse? It’s hard to evaluate because the week, and the contiguous working week, are so much a part of our world that I imagine that today is the first day that some of you have thought about it.
Back to education and, right now, we count time for our students because we have to work out bills and close off accounts at end of financial year, which means we have to meet marking and award deadlines, then we have to project our budget, which is yearly, and fit that into accredited degree structures, which have year guidelines…
But I cannot give you a sound, scientific justification for any of what I just wrote. We do all of that because we are caught up in industrial time first and we convince ourselves that building things into that makes sense. Students do have ebb and flow. Students are happier on certain days than others. Transition issues on entry to University are another indicator that students develop and mature at different rates – why are we still applying industrial time from top to bottom when everything we see here says that it’s going to cause issues?
Oh, yes, the “real world” uses it. Except that regular studies of industrial practice show that 40 hour weeks, regular days off, working from home and so on are more productive than the burn-out, everything-late, rush that we consider to be the signs of drive. (If Henry Ford thinks that making people work more than 40 hours a week is bad for business, he’s worth listening to.) And that’s before we factor in the development of machines that will replace vast numbers of human jobs in the next 20 years.
I have a different approach. Why aren’t we looking at students more like we regard our grape vines? We plan, we nurture, we develop, we test, we slowly build them to the point where they can produce great things and then we sustain them for a fruitful and long life. When you plant grape vines, you expect a first reasonable crop level in three years, and commercial levels at five. Tellingly, the investment pattern for grapes is that it takes you 10 years to break even and then you start making money back. I can’t tell you how some of my students will turn out until 15-25 years down the track and it’s insanity to think you can base retrospective funding on that timeframe.
You can’t make your grapes better by telling them to be fruitful in two years. Some vines take longer than others. You can’t even tell them when to fruit (although can trick them a little). Yet, somehow, we’ve managed to work around this to produce a local wine industry worth around $5 billion dollars. We can work with variation and seasonal issues.
One of the reasons I’m so keen on MOOCs is that these can fit in with the routines of people who can’t dedicate themselves to full-time study at the moment. By placing well-presented, pedagogically-sound materials on-line, we break through the tyranny of the 9-5, 5 day work week and let people study when they are ready to, where they are ready to, for as long as they’re ready to. Like to watch lectures at 1am, hanging upside down? Go for it – as long as you’re learning and not just running the video in the background while you do crunches, of course!
Once you start to question why we have so many days in a week, you quickly start to wonder why we get so caught up on something so artificial. The simple answer is that, much like money, we have it because we have it. Perhaps it’s time to look at our educational system to see if we can do something that would be better suited to developing really good knowledge in our students, instead of making them adept at sliding work under our noses a second before it’s due. We are developing systems and technologies that can allow us to step outside of these structures and this is, I believe, going to be better for everyone in the process.
Conformity isn’t knowledge, and conformity to time just because we’ve always done that is something we should really stop and have a look at.
The Sad Story of Dr Karl Kruszelnicki
Posted: April 16, 2015 Filed under: Education, Opinion | Tags: advocacy, authenticity, blogging, Dr Karl, education, educational problem, ethics, feedback, higher education, Karl Kruszelnicki, reflection, teaching, teaching approaches, thinking Leave a commentDr Karl is a very familiar face and voice in Australia, for his role in communicating and demystifying science. He’s a polymath and skeptic, with a large number of degrees and a strong commitment to raising awareness on crucial issues such as climate change and puncturing misconceptions and myths. With 33 books and an extensive publishing career, it’s no surprise that he’s a widely respected figure in the area of scientific communication and he holds a fellowship at the University of Sydney on the strength of his demonstrated track record and commitment to science.
It is a very sad state of events that has led to this post, where we have to talk about how his decision to get involved in a government-supported advertising campaign has had some highly undesirable outcomes. The current government of Australia has had, being kind, a questionable commitment to science, not appointing a science minister for the first time in decades, undermining national initiatives in alternative and efficient energy, and having a great deal of resistance to issues such as the scientific consensus on climate change. However, as part of the responsibilities of government, the Intergenerational Report is produced at least every 5 years (this one was a wee bit late) and has the tricky job of crystal-balling the next 40 years to predict change and allow government policy to be shaped to handle that change. Having produced the report, the government looked for a respected science-focused speaker to front the advertising campaign and they recruited Dr Karl, who has recently been on the TV talking about some of the things in the report as part of a concerted effort to raise awareness of the report.
But there’s a problem.
And it’s a terrible problem because it means that Dr Karl didn’t follow some of the most basic requirements of science. From an ABC article on this:
“Dr Kruszelnicki said he was only able to read parts of the report (emphasis mine) before he agreed to the ads as the rest was under embargo.”
Ah. But that’s ok, if he agrees with the report as it’s been released, right? Uhh. About that, from a Fairfax piece on Tuesday.
“The man appearing on television screens across the country promoting the Abbott government’s Intergenerational Report – science broadcaster Karl Kruszelnicki – has hardened his stance against the document, describing it as “flawed” and admitting to concerns that it was “fiddled with” by the government.” (emphasis mine, again)
Dr Karl now has concerns over the independence of the report (he now sees it as a primarily political document) and much of its content. Ok, now we have a problem. He’s become the public face of a report that he didn’t read and that he took, very naïvely, on faith that the parts he hadn’t seen would (somewhat miraculously) reverse the well-known direction of the current government on climate change. But it’s not as if he just took money to front something he didn’t read, is it? Oh. He hasn’t been paid for it yet but this was a paid gig. Obviously, the first thing to do is to not take the money, if you’re unhappy with the report, right? Urm. From the SMH link above:
“What have I done wrong?” he told Fairfax Media. “As far as I’m concerned I was hired to bring the public’s attention to the report. People have heard about this one where they hadn’t heard about IGR one, two or three.”
But then public reaction on Twitter and social media started to rise and, last night, this was released on his Twitter account:
“I have decided to donate any moneys received from the IGR campaign to needy government schools. More to follow tomorrow. Dr Karl.”
This is a really sad day for science communication in Australia. As far as I know, the campaign is still running and, while you can easily find the criticism of the report if you go looking for it, a number of highly visible media sites are not showing anything that would lead readers to think that anyone had any issues with the report. So, while Dr Karl is regretting his involvement, it continues to persuade people around Australia that this friendly, trusted and respected face of science communication is associated with the report. Giving the money away (finally) to needy schools does not fix this. But let me answer Dr Karl’s question from above, “What have I done wrong?” With the deepest regret, I can tell you that what you have done wrong is:
- You presented a report with your endorsement without reading it,
- You arranged to get paid to do this,
- You consumed the goodwill and trust of the identity that you have formed over decades of positive scientific support to do this,
- You assisted the on-going anti-scientific endeavours of a government that has a bad track record in this area, and
- You did not immediately realise that what you had done was a complete failure of the implicit compact that you had established with the Australian public as a trusted voice of rationality, skepticism and science.
We all make mistakes and scientists do it all the time, on outdated, inaccurate, misreported and compromised data. But the moment we know that the data is wrong, we have to find the truth and come up with new approaches. But it is a serious breach of professional scientific ethics to present something where you cannot vouch for it through established soundness of reputation (a ‘good’ journal), trusted reference (an established scientific expert) or personal investigation (your own research). And that’s purely in papers or at conferences, where you are looking at relatively small issue of personal reputation or paper citations. To stand up on the national stage, for money, and to effectively say “This is Dr Karl approved”, when you have not read it, and then to hide behind an “but I was only presenting it” defence initially is to take an error of judgement and compound it into an offence that would potentially strip some scientists of their PhDs.
It’s great that Dr Karl is now giving the money away but the use of his image, with his complicity, has done its damage. There are people around Australia who will think that a report that is heavily politicised and has a great deal of questionable science in it is now scientific because Dr Karl stood there. We can’t undo that easily.
I don’t know what happens now. Dr Karl is a broadcaster but he does have a University appointment. I’ll be interested to see if his own University convenes an ethics and professional practice case against him. Maybe it will fade away, in time. Dr Karl has done so much for science in Australia that I hope that he has a good future after this but he has to come to terms with the fact that he has made the most serious error a scientist can make and I think he has a great deal of thinking to do as to what he wants to do next. Taking money from a till and then giving it back when you get caught doesn’t change the fact of what you did to get it – neither does agreeing to take cash to shill a report that you haven’t read.
But maybe I am being too harsh? The fellowship Dr Karl holds is named after Dr Julius Sumner Miller, a highly respected scientific communicator, who then used his high profile to sell chocolate in his final years (much to my Grandfather’s horror). Because nothing says scientific integrity like flogging chocolate for hard cash. Perhaps the fellowship has some sort of commercialising curse?
Actually, I don’t think I’m being too harsh, I wish him the best but I think he’s put himself into the most awful situation. I know what I would do but, then, I hope I would have seen that, just possibly, the least scientifically focused government in Australia might not be able to be trusted with an unseen report. If he had seen the report and then they had changed it all, that’s a scandal and he is a hero of scientific exposure. But that’s not the case. It’s a terribly sad day and a sad story for someone who, up until now, I had the highest respect for.
