
Humanities Intensive Learning + Teaching, Day 4, Maryland Institute for Technology in the Humanities, #hilt2014
Posted: August 8, 2014 Filed under: Education | Tags: clowns, cMOOC, data visualisation, Elijah Meeks, Francis Bacon, Franco Moretti, Gephi, Google, graphs, Hamlet, Hamlet Hamlet Hamlet, HILT, HILT 2014, HITS, Horatio, map, Medicis, MITH, monkey, MOOC, Moretti, network, network visualisation, PageRank, RDF, Shakespeare, Small worlds, Tufte, visualisation, xMOOC, Zelchenko Leave a commentOr, the alternative title, “The Play Formerly Known as Hamlet”. Today had a lot of fascination discussion where the bipartite nature of our class network became apparent, in terms of the the majority of the class who were Digital Humanists and really understood a detailed close reading of Hamlet – and your humble narrator.
Today we talked about modularity, which allows you to break your network up into separate modules, which makes a lot more sense when you call those modules things like communities, groups or clusters. Can your network be split up into areas where some groups are more connected to each other than they are to adjacent nodes? By doing this, we are trying to expose structural features of the network and, in particular, unexpected aspects of network structure – is there some set of nodes that have a role in the network that we don’t understand? If we talk about this in terms of people, if our social network is made up of small communities with connections between the communities, then we would expect gossip to spread more rapidly inside a community than between the communities. Simple, eh? The approach we take depends upon comparing the structure we have with a model of a random network using the same number of links.
Once we’ve done this, we can use this in a tool, such as Gephi, to clearly illustrate the groups. Here’s a grumpy Dane in illustration.

Hamlet and the various posses of Hamlet. Note the Insane Clown Posse.
I’ve coloured and tagged the network to show the key players in Hamlet, based on Moretti’s analysis of Hamlet, which attached unweighted connections between participants who had direct conversations. Now, we’ve made the size of the nodes reflect how relatively important (in terms of betweenness, the number of paths that must go through this person). If we did this in terms of PageRank, another measure of the relative importance of nodes, based on their connectivity, the nodes in green would jump up in size. But what you should note is that Hamlet and Horatio are roughly the same size and, while Hamlet is much more connected to everyone (quelle surprise, given the play’s named after him), the only thing that we lose if Hamlet disappears is that we no longer can hear from the Insane Clown Posse, Lucianus and the Lord. In purely connected terms he doesn’t appear to be that important. We’d obviously lose a lot of the text if he disappeared but how important is Hamlet in Hamlet?
This led to a lot of discussion in class as to the validity of the original Moretti pamphlet, much of which is core to the entire discussion of Digital Humanities. How valid is any conclusion from a network model such as this when the innate nature of the capture process (to provide the capta) may completely remove the ability to draw certain conclusions? The class discussed the impact on perceived and invisible observers, who strictly don’t have dialogue with each other but potentially have an impact upon other characters and their narrative interactions. (The Moretti pamphlet may be found here.) Moretti had a lot to say about Horatio as a proxy for the state and was very interested in the closeness of Hamlet to everyone else, but (later on) we ran some random network experiments and it turned out to be the type of connections in the network (the clustering coefficient) that was more interesting than the closeness.
We then moved on to a discussion of a number of useful metric for networks, including the clustering effects that tend to indicate intention in the system we’re studying (there’s no real reason for a random network to form a small number of unique clusters unless you tune for it.) We also discussed the Small Worlds of Watts and Strogatz (1998) where you have cliques of nodes (tightly connected clusters) linked together by a smaller number of links, characterised by a power law distribution and a higher clustering coefficient (very basically).
We generated some random graphs to see if we got the structure we saw in Hamlet as noted earlier. Why? Because looking at Hamlet and drawing out information from the structure only has validity if (1) the model is accurate and (2) the situation couldn’t have easily arisen by chance. As noted, we generated a random graph for the same number of nodes and it had a similar average path length and identical diameter – but very different clustering coefficients! So it turns out that Hamlet wasn’t written by a monkey after all.

Don’t laugh, this is Darwin’s skull!
The final part of the session was on dynamic networks. This is the study of networks that change over time and we worked with some data that showed people’s association with an area over time. We could look at this in terms of change in time or in terms of progress through a corpus (chapters are as useful as dates here). What you want is a start date and an end date for the feautres in your network – when should the feature be there and when should it not be there anymore? It turns out that Gephi is quite convenient here, because you can merge a start and end time and end up with a time interval. Not bad, Gephi, not bad. Now we can see when things are active – great if you’re looking to see when students are active in forums or activities, for example. Here’s an example of the difference in the test network between the first and second halves of 2009, with all nodes of zero degree (nodes with no links) removed.

First half of 2009

Second half of 2009
We then played around a lot with a vide variety of animations over time, including ongoing calculations, colour and shape alterations. Basically, it was rather hallucinatory by the end but that may be the Dr Pepper talking. We even got to see the sparklines (Zelchenko/Tufte) for some extra visualisation goodness!
This is one of those classic separations between the things we visualise for ourselves to help us to work out what’s interesting about a dataset and what we would visualise for presentation, especially to non-discipline people. There’s a really big difference between what scientists want to see and what other people want to see – and if we don’t realise that, then we risk either having presentations that don’t communicate enough information or we kill people with minutiae. Look at this – how useful is it for you?

Death by Sparkline!
Another good day but I think there are some very full brains!
Humanities Intensive Learning + Teaching, Day 3, Maryland Institute for Technology in the Humanities, #hilt2014
Posted: August 8, 2014 Filed under: Education | Tags: capta, cMOOC, data visualisation, Elijah Meeks, Florence, Google, graphs, HILT, HILT 2014, HITS, map, Medicis, MITH, MOOC, network, network visualisation, PageRank, RDF, visualisation, xMOOC Leave a commentToday was going to be a short day because we had the afternoon off to go and do cultural things. (I took the afternoon to write papers and catch up on work. I tend to work in both timezones when travelling because otherwise work will eat my head.) Today we explored a lot of filtering in Gephi, which was … interesting and best done in practice. Which we did. So, hooray!
We looked at Multimodal Network Projection throughout the day but I’ll come back to that. We started looking at other ways of determining the important and dependant nodes in a network, starting with the HITS algorithm, which identifies Hubs and Authorities in your network.
Then we moved into the wonderful world of PageRank, Citation networks and how all of these things work. PageRank is, fundamentally, how Google works out which pages to give you. You won’t be able to find out the details of the way that Google runs PageRank because gaming PageRank to serve up pages that you probably didn’t want to see is very big business and highly irritating. Search Engine Optimisers (SEOs) spend a lot of time trying to reverse engineer the algorithm and Google spends a lot of time tweaking it. It’s good we’ve solved all the important problems in the world so we can spend time on this.
Back to PageRank. PageRank looks at the number of links going to a node and what the quality of these links is in order to work out which the most important nodes (pages in the case of Google search) are and, hence, which ones you want. In Digital Humanities, you can use this to identify the most significant element of your model – which, by the way, quickly establishes that Hamlet is not as important as you think. Take that, Hamlet! Want more detail on PageRank? Look here.

From Wikipedia: The more you are pointed to by quality links, the bigger (and happier) you are. Hooray!
In Citations, we want to see how is citing which reference, which is straightforward. In Co-Citation networks, we want to measure how often two documents are cited together. There are many reasons for looking at this, but it helps to detect things like cronyism (someone citing a paper because they like someone rather than because the information is useful). As we discussed before, the Matthew Effect comes in quickly, where frequently cited papers get even more frequently cited because they must be good because they’re cited so frequently. (Tadahhh.)
We also looked at a rather complicated area of multimodal projection, which is going to need some set-up. If you have a set of authors and a set of publications, then you can associate authors with publications and vice versa. However, this means that the only way for two authors to be connected is by sharing a publication and similarly for two publications sharing an author. This is a bipartite network and is very common in this kind of modelling. Now, if we make it more complicated, by moving to a conference and having Authors, Papers and Presentation Sessions, we now have a tripartite network and this becomes very hard to visualise.
What we can do is clean up this network to make it easier to represent by hiding some of the complexity in the connections between nodes. Let’s say we want to look at Authors and Presentation Sessions. Then, while the real network is Authors connected to Papers connected to Presentation Sessions, we can hide the Papers with a network link that effectively says “connects this author via a presentation to this session” and suddenly our network looks like it’s only Authors and Sessions. This level of visual de-cluttering, which is dimensional reduction for those playing along at home, makes it easier for us to visually represent the key information and produce network statistics on these simpler graphs. It’s also a natural fit for triple-based representations like the Resource Description Framework (RDF) because the links in the network now map straight to predicates. (Don’t worry if you didn’t get that last bit, some people just got very excited.)
Finally, we looked at how we collect information. Is it stuff we just pick up from the environment (data) or is it something that we choose the way that we collect it (capta)? (Capta comes from the word for capture. Data is passive. Capta is active. Take that, Bembridge Scholars!) If you think about it, every time you put your data into a spreadsheet, you are imposing a structure upon it, even down to which column is which – it’s not technically data, it’s capta because your interpretation alters it before it even reaches the analysis stage. When it comes to the network that you draw, do you care about the Proximities of elements in your network (location, membership or attitude), the Relations in your network (role, affective, perceptual), the Interactions or the Flows? All of these are going to change what the nodes and edges (links) represent in the network.
The simple rule is that entities are connected by relationships (For those who think in tuples, think “subject, predicate, object” and get your predicate on!) However you do it, you have to pick what’s important in your data, find it, capture it, analyse it and present it in a way that either shows you cool things or supports the cool things that you already know.
A lot to cover today!
After the session, I did some work and then headed off for dinner and board games with some of the other people from the workshop. A nice relaxing night after a rather intense three days.
Humanities Intensive Learning + Teaching, Day 2, Maryland Institute for Technology in the Humanities, #hilt2014
Posted: August 8, 2014 Filed under: Education | Tags: betweenness, centrality, cMOOC, data visualisation, Elijah Meeks, Florence, graphs, HILT, HILT 2014, Medicis, MITH, MOOC, network, network measurements, network visualisation, visualisation, xMOOC Leave a commentIn Day 2, we looked at using the Gephi tool itself, along with the nature of how networks are tied together, looking at network degree and how we could calculate paths through the network. It’s probably important to talk about some of the key concepts of how we measure connectedness in a network, and the relevant importance of nodes.
The degree of a node is the number of links that connect to it. If we care about whether the links have some idea of direction associated with them then we might split this into in-degree and out-degree, being the number of links going in and the number of links going out. What do we mean by direction? Consider Facebook. If you and I are going to be Friends then we both have to agree to be Friends – I can’t be a friend unless you want to a friend to. This is an undirected arrangement and a connection between us implies that both us have an equal connection to each other. Now think about unrequited love: Duckie loves Andie but Andie loves Blane. In this case, the love is directed. Just because Duckie loves Andie, it doesn’t mean that Andie loves Duckie.

Time to put on some Psychedelic Furs and find the alternate ending. (Yeah, yeah, it’s not actually in the story and it’s creepy.)
ALTHOUGH IT SHOULD, JOHN HUGHES!!!
(An amusing aside for network/maths people is that, sadly, love is not transitive or “Pretty in Pink” would have been way ahead of its time.)
One of the other things that we care about in networks is the relative importance of nodes in terms of how many other nodes they are connected to and what this means in terms of the paths we take through the network. When we talk about paths, we usually mean the shortest path, where we start somewhere and go through the minimum number of intermediate points until we get to the destination. We don’t run around in circles. We don’t go one way and then go another. This is important because the paths through a network can quickly identify the important nodes and, therefore, the links between them that are the most travelled thoroughfares.
In this world, we start to worry about the centrality of a node, which indicates how important it is by looking at how many other nodes it is connected to or how many other nodes have to use it to get to other places in the network. This means that we have to talk about betweenness, which measures how many times the shortest paths that traverse a network have to go through a node. By calculating the betweenness of every node, for every path, we can work out which of the elements in our network see the most traffic.
In the case of the Medicis, from yesterday, all roads in Florence lead to the Medicis, the family with the highest betweenness rather than the family with the most money or fame. The Medicis are an extreme case because they occupy their position of importance as the only bridge (broker) between certain families.
If a network is made of highly connected elements and all of the betweenness is the same then no-one has an advantage. If your network can be effectively split into two highly connected groups, with a smaller number of high-betweenness elements linking them, then you are seeing a separation that may mean something significant in your particular network domain. From a power perspective, the high betweenness brokers now have the potential to have much more influence if they charge for transit and transform information that traverses them.
One of the things about creating a network from data is that the network we create may not necessarily model reality in a way that answers the questions we’re interested in, but by looking at the network and trying to work out if it’s got some different structure at the macro, meso and micro scale, then that might give us hints as to how to analyse it, to further develop our understanding of the area that we’re modelling with this network.
I’ve written about the difference between the real world and the model before, but let’s just say that “the map is not the territory” and move on. In terms of the structure of networks, while many people assume that the distribution of nodes and links associated with them would end up in some sort of Normal distribution, the truth is that we tend to see a hub-spoke tendency, where there are lots of nodes with few links and fewer nodes with lots of links. When we start to look at the detailed structure rather than the average structure, we can even talk about uniform the structure is. If a network looks the same across itself, such as the same number of connections between nodes, then it’s what we call assortative. If we have small clusters of highly connected nodes joined to other clusters with sparse links, then we’d thinking of it as disassortative. Suddenly, we are moving beyond some overall statistics to look at what we can really say about the structure of a network.
There’s also a phenomenon known as the Matthew Effect, where links and nodes added to a network tend to connect to better connected nodes and, as the network grows, nodes with more connections just get more connected – just like life.
Apart from a lot of Gephi, we finished the day by looking at paths in more detail, which allow us to talk about the network diameter, the size of the largest shortest path in the network. (Remembering that a shortest path contains no loops or false starts, so the largest shortest path shows you the largest number of unique nodes you can visit in the network and gives you an idea of how much time you can waste in that network. 🙂 )
There are some key concepts here, where having redundant paths in a network allows us to survive parts of a network going away (whether computer or social) and having redundant paths of the same quality allows us to endure loss without seeing a significant change in the shortest paths in the network. These are all concepts that we’re familiar with in real life but, once we start to measure them in our network models, we find out the critical components in our data model. If we’re modelling student forums, is there one person who is brokering all of the communication? What happens if she gets sick or leaves the course? Now we have numbers to discuss this – for more, tune in to the next instalment!
Humanities Intensive Learning + Teaching, Day 1, Maryland Institute for Technology in the Humanities, #hilt2014
Posted: August 6, 2014 Filed under: Education | Tags: cMOOC, data visualisation, Elijah Meeks, Florence, graphs, HILT, HILT 2014, Medicis, MITH, MOOC, network, network visualisation, visualisation, xMOOC Leave a commentI’m attending the Humanities Intensive Learning + Teaching courses at Maryland Institute for Technology in the Humanities, #hilt2014, for the second year running. Last year was Matt Jocker’s excellent course on R and this year I’m attending Elijah Meek’s course on Network Analysis and Visualisation. The first day we covered network basics and why you might want to actually carry out visualisation across graphs – and what the hell are graphs anyway?
Graphs, put simply, are a collection of things and connections between those things. Now that I’ve killed every mathematician reading this blog, let’s continue. I’ve done a lot of work on this before in the Internet Topology Zoo but it’s now looking like analysis of large-scale online education is something I have to get good at, so it seemed a great opportunity to come and see how the DH community do this and get access to some mature processes and tools.
Why is this important as a visualisation (or representation, thanks, Elijah) target? Because pictures tell stories well and we can use this to drive argument and make change.
Let’s consider the Medici, the family who dominated Florence from the 1400s to the 18th century. While not being the most wealthy and powerful families at the outset, they were (by marriage and arrangements) one of the most well connected families. In fact, the connections from some groups of families to other families had to go through the Medicis – which made them more important because of their role in the network.

Padget & Ansell’s network of marriages and economic relationships between Florentine families. (from http://www.themacroscope.org/?page_id=308)
The graph makes the relationship and the importance clear. (Insert toast about Boston, Lowells and Cabots here.)
In graphs of the Internet, everything is connected to the Internet by definition, so we don’t have any isolated elements. (We do have networks that don’t connect to the Internet, such as super-secret defence networks and some power stations – not as many as there used to be – but we’re interested in the Internet.) It is possible to analyse communities and show ways that some people/entities/organisations are not connected to each other. Sometimes they form disconnected clusters, sometimes they sit by themselves, and this is where my interest comes in, because we can use this to analyse student behaviour as a learning community.
A student who enrols in your course is notionally part of your community but this is an administrative view of the network. It’s only when they take part in any learning and teaching activity that they actually become part of the learning community. Suddenly all of the students in your network can have a range of different types of connection, which is a good start to finding categories to talk about behaviour in large on-line courses, because now we can easily separate enrolment from attendance, attendance from viewing, viewing from participation in discussion, and discussion from submission of work. I hope to have a good look into this to find some nice (convenient) mathematical descriptions of the now defunct cMOOC/xMOOC distinction and how we can encourage behaviour to get students to form robust learning networks.
As we can see from the Medicis, the Medicis used their position in order to gain power – it wasn’t in their interests to form additional connections to make the network resilient if they fell on hard times. However, learning networks don’t want a central point that can fail (central points of failure are to be avoided in most contexts!) and this is why a learning community is so important. If students are connected to many other students and their lecturing staff, then the chances of one relationship (connection) failing causing the whole network to fail is very low. Some people are, naturally, very important in a learning community: we’d hope that instructors would be, tutors would be, and key students who handle discussions or explanations also would be. However, if we have very few of these important people, then everyone else is depending upon this small number to stay connected and this puts a lot of stress on these people and makes it easy for your network to fall apart.
I’ll talk more about this tomorrow and hit you with you some definitions!
Teaching in Hong Kong, Reflections
Posted: July 26, 2014 Filed under: Education | Tags: AsiaBound, Computer Emergency Response Team, computer security, CUHK, CUHK campus, education, evaluation, exams, exchange, higher education, Hong Kong, learning, Lee Woo Sing, Lee Woo Sing College, networking, podcasts, reflections, security, students, teaching, thinking Leave a commentI used to wait for a while before writing my reflections, to give myself time to sort the information and think about things. These days, one amazing thing finishes and then another starts. I’ve had a lot less free time than I thought I would on this course and I have about a day of downtime before starting work again on Monday (I fly back this afternoon) and then I’m off again on another project a week from then. So I’ll try and capture my thoughts now, although I always hope to come back and adjust them later as I think. (I actually have a maxim when I’m travelling to “do it while I’m there” because I’ve discovered that, too often, the way back takes you on a different path, so I may never revisit this but, knowing this, I’ll try to put in as much as I can.)
In talking to the students, and in seeing their marks, this has been a success but, like all pathfinders, the problem now is marking the trail so that other people can find it. How do we do this again? How do we it better? Well, we’re already talking about setting up the administration earlier to get some things going that we wanted the first time around and I’ve got a list of suggestions from the students as to what they think could be better.
But this was a strong validation of guided study groups, blended learning, flipping, collaborative work and giving students some freedom. This also justified putting the effort into industry visits and sharing what we do in our school with our students. This has been an excellent educational experience, with emphasis on both parts of that. The community has made it work, because the students commented that they’d never spent so much time digging into references to understand what was going on, and that discussion was an important part of that. However, their physical proximity allowed them to do it face-to-face, rather than on a forum.
That’s an interesting point – if you look at our electronic footprint, you’d think the course was a failure. Instead, because we spent at least 3-4 hours together every day, issues were resolved quickly and only broadcast when they had to be. You’d be right in assuming that that can be a little wearing on the instructor, because you’re always on, but that’s why I’m here.
The next trick is going to be getting this to work for less crazy instructors – in the last couple of days, I’ve been really tired, because the constant “on” (while doing my normal job back home in the cracks) is not what I’m used to and I don’t have my usual home comforts to settle back in to, in order to unwind. Not a big complaint, as I’ve been very comfortable, but a lot of people would find it hard to leave their families for three weeks, let alone act as mentor, guide and teacher to 10 people across that time. Having said that, the students have been great and I’ve worried more about them as a general principle than I’ve had to deal with as a reaction to problems. But it is still wearing.
Probably, the most important thing to do next time is to go ahead with the pan of integrating local students as well, to maximise the mix. Travel broadens the mind, because the longer you spend in other cultures, the more of your own you can start to see without your own biases. We’ve done very well in exposing students to different areas of HK and Macua, in seeing other communities and industries, and in meeting people – but this would be so much better if they worked side-by-side with students from CUHK. Apart from a learning experience, we could be building working and friendship relationships measured in decades rather than a trip measured in weeks.
In summary, it went well and we managed to combine engaging learning with effective learning – so I’m very happy to call this a successful start, already.
If you’ve been following the course, thanks for reading, and I’m always happy to answer questions in the comments! Ciao!
Take us out, Bruce!

EMBRACE YOUR AWESOMENESS! Don’t make me come over and sing “Blinded by the Light!”
Teaching in Hong Kong, Day 15 (Final Day)
Posted: July 26, 2014 Filed under: Education | Tags: alumni, AsiaBound, Computer Emergency Response Team, computer security, CUHK, CUHK campus, durian, education, exams, exchange, higher education, Hong Kong, learning, Lee Woo Sing, Lee Woo Sing College, networking, podcasts, security, students, teaching Leave a commentThe final day started a little late as we didn’t have as much to do. At 10am we kicked off with a quick end-of-course note from me, thanking the students for their enthusiasm and their participation, and their willingness to go along with the whole scheme. They, in turn, presented me with a very large book about cats (a running theme in the course and my own family contains three cats – where, by contains, I of course mean exists for the service of) which they had all inscribed. It was a delightful way to start the day!
Shally and Louis from the OAL came along and we presented them with gifts to thank them for all of their help and support during the last three weeks: Australian wine and excellent chocolate, in case you’re wondering. They, in turn, presented us with lemon cake, a CUHK dessert speciality, which is a sort of lemony.. frozen.. corn flakey… iced? treat that is deliciously indescribable! Thank you again to everyone at CUHK: Shally, Louis, Phoebe, Daniel and Cora, for all of your help while we’ve been here!

Seconds (and thirds) are had.
After a very pleasant 30 minutes, we got back to the final on-campus business, the quiz and the short-answer exam. With that concluded, I was able to inform the students to check their marks to look at their progress and some students will notice that they already have enough raw marks to pass – although they won’t stop now!
That concluded the course, except for a vegetarian dinner at a Buddhist “mock meat” restaurant in Hung Hom, arranged by David, our Alumni Ambassador for Hong Kong and China. The meal was astounding and we got take a double decker bus ride through Hung Hom from the MTR to get there – adding another experience into the mix! Here are some of the photos and dishes from the meal:

All of this is vegetarian but you can’t tell from the taste or the texture.
Here are two pictures with David serving from the (ample) banquet and the students enjoying themselves:
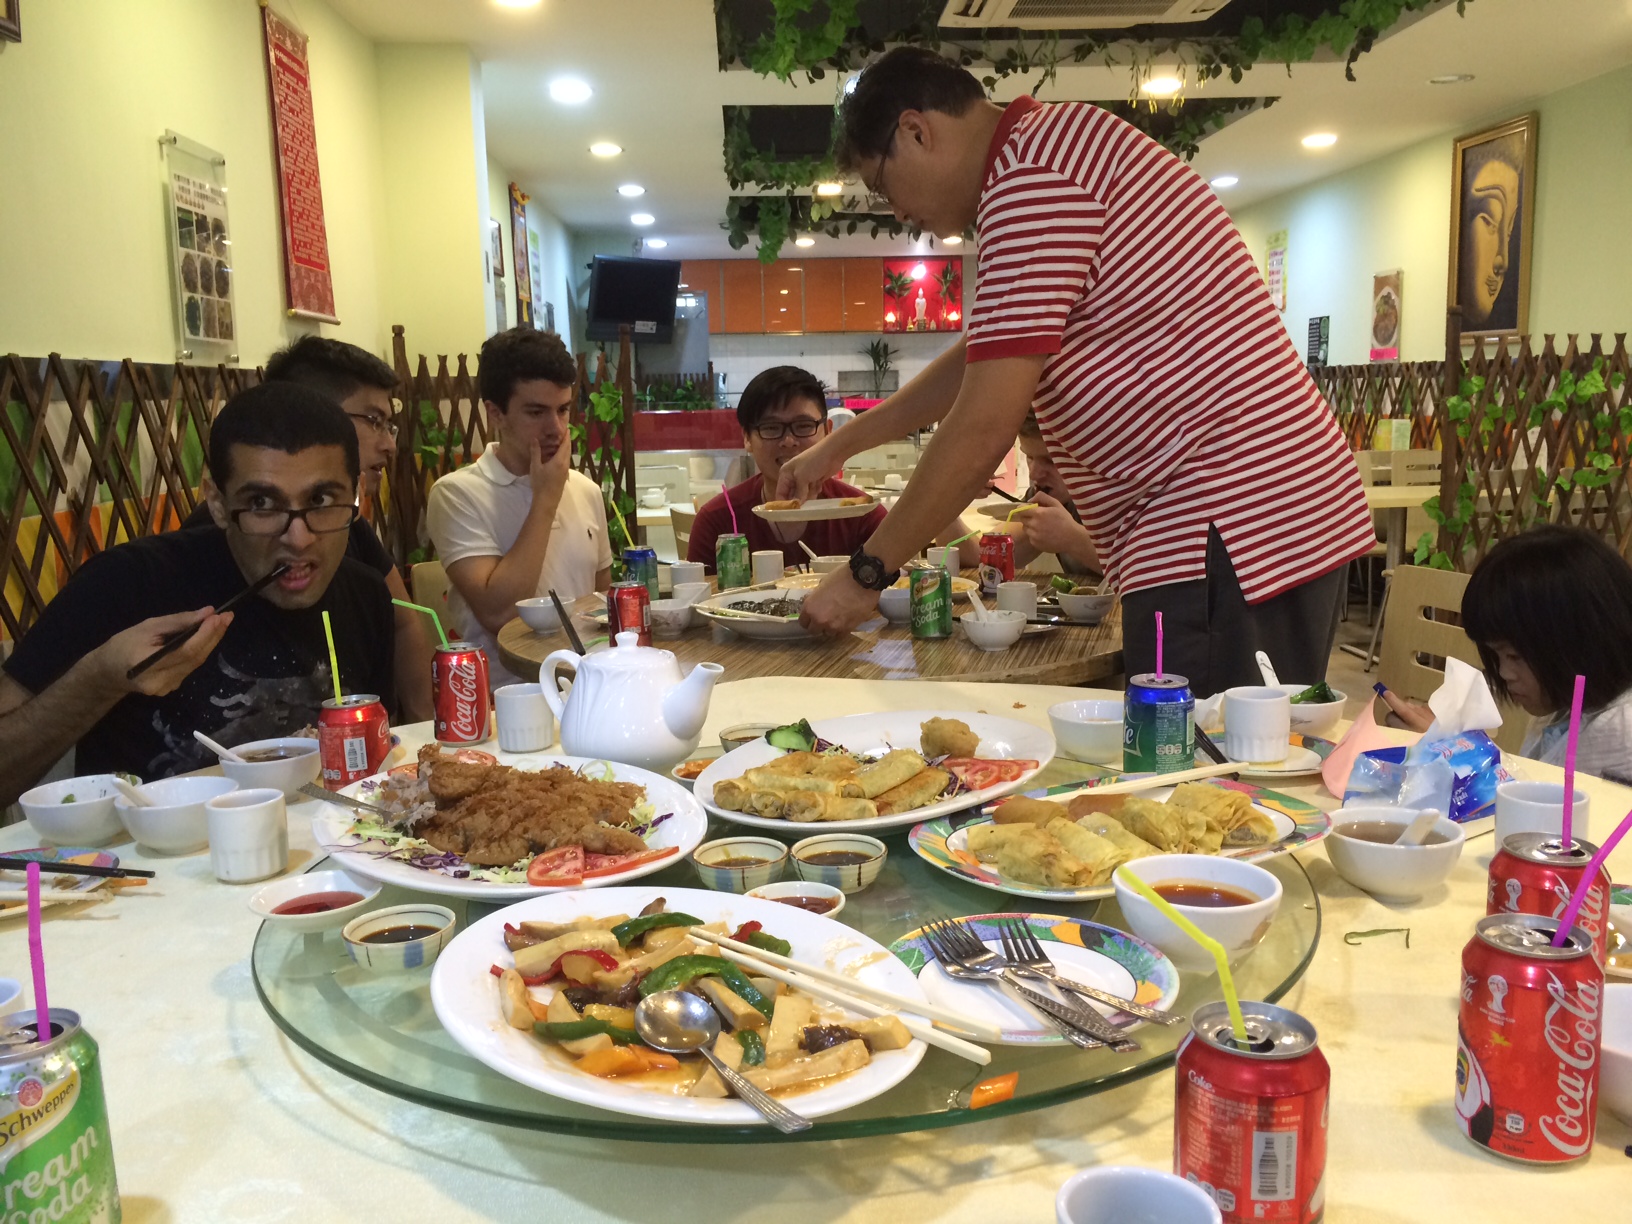

(The very small student is David’s daughter – Ashley.) Those of you with sharp eyes might recognise the fruit on the table as Durian – the King of Fruits and the fruit with one of the most amazing reputations. David went out specially to go and get two beautiful durians for the students to try something new (Kelvin and I needed no convincing as we are both strongly committed to the durian) and most people were very pleasantly surprised that the smell wasn’t as bad as they’d heard and that the taste was very much worth pursuing It is, however, amazingly rich, there’s a lot of the avocado richness concealed in the ultra-mango and (being honest) spring onion flavours of the durian.
Here’s the final picture of the course, standing proud in front of the defeated durian. We came to Hong Kong to learn, to experience and to have a lot of fun. And we did all three. Thank you, Hong Kong!

Thumbs up and mug for the camera!
Teaching in Hong Kong, Day 14
Posted: July 25, 2014 Filed under: Education | Tags: AsiaBound, Computer Emergency Response Team, computer security, CUHK, CUHK campus, education, exams, exchange, heartbleed bug, higher education, Hong Kong, learning, Lee Woo Sing, Lee Woo Sing College, networking, podcasts, security, SSL, students, teaching, xkcd Leave a commentThursday the 24th was a very straightforward day as we were bringing most of the coursework to a close and moving into the evaluation phase – not just for the students but for the course itself. We started with a tutorial on security, where we went through a range of issues and looked into the most commonly occurring problems, as recorded by the Computer Emergency Response Team (CERT) webpage. A lot of the problems we get are caused by:
- Programmers not checking what users type into their programs.
- Programmers not properly limiting what programs send to each other.
- “Back door” exploits where hard-coded usernames and passwords are left in.
We had a chance to discuss white hat and black hat hacking – patching a bug will get you a small cheque and a shout out, reporting an exploit to a criminal syndicate can make you rich. (And hunted or dead, for that matter.) It’s an interesting area – ethically and academically.
I’d asked the students, on Tuesday, to pick an area of security to talk about for 5-10 minutes and this proved to be a really interesting activity, taking longer than the hour I’d allotted for it. Topics included the Stuxnet Worm, and you can imagine we got a lot of interesting discussion out of this one, mobile device problems, the RTM Work from 1988, Botnets, Cross-site scripting issues, and the Heartbleed bug. (Compulsory XKCD comic here.)

XKCD 1354 – Heartbleed explained concisely and accurately.
I like asking the students to go out and find things because, by presenting it to each other, we get infectious enthusiasm and we have people applying their knowledge to reinforce what we’ve learned in class.
Then, for the final hour, we sat down and discussed the course itself. The students are still free to put in anonymous reports on things they don’t feel comfortable discussing with me, but I wanted to get a feel for what we should be improving. Overall, the course has been a great success and, teaching-wise, it’s gone pretty well. We have to smooth out some administration issues on our side but we already knew that and we’re starting the planning process for the next time in the next week.
It’s really great for me to get a sense that the students both enjoyed the course and learned from the course. As we always say, engaging isn’t always effective, but in this case it appears that it has been and, so far, the results I’ve seen reflect that we’ve achieved a great deal in a short time.
Only one day left, which is mostly a final talk from me, some “thank you”s and a dinner. Then we all start our flights home.
Only two more updates for this trip to come – the final Friday and my overall reflections. Hang in there, I’m nearly done!
Teaching in Hong Kong, Day 13 – MACAU!
Posted: July 25, 2014 Filed under: Education | Tags: AsiaBound, Central, CUHK, CUHK campus, education, egg tart, exams, exchange, higher education, Hong Kong, learning, Lee Woo Sing, Lee Woo Sing College, Macao, macau, Mandarin, networking, Ozone Bar, Portuguese, Ritz-Carlton, St Pauls, students, Taxi, teaching Leave a commentWe decided to add some interesting activities on the Wednesdays, to provide a break from the course, and Wednesday the 23rd saw us going to Macau (or Macao), another Special Administrative Region and a former Portuguese colony bordering on China. I picked up the students at the University train station and we headed down to Sheung Wan on Central for the ferry. It turns out that Hong Kong’s MTR system is busy during rush hour:
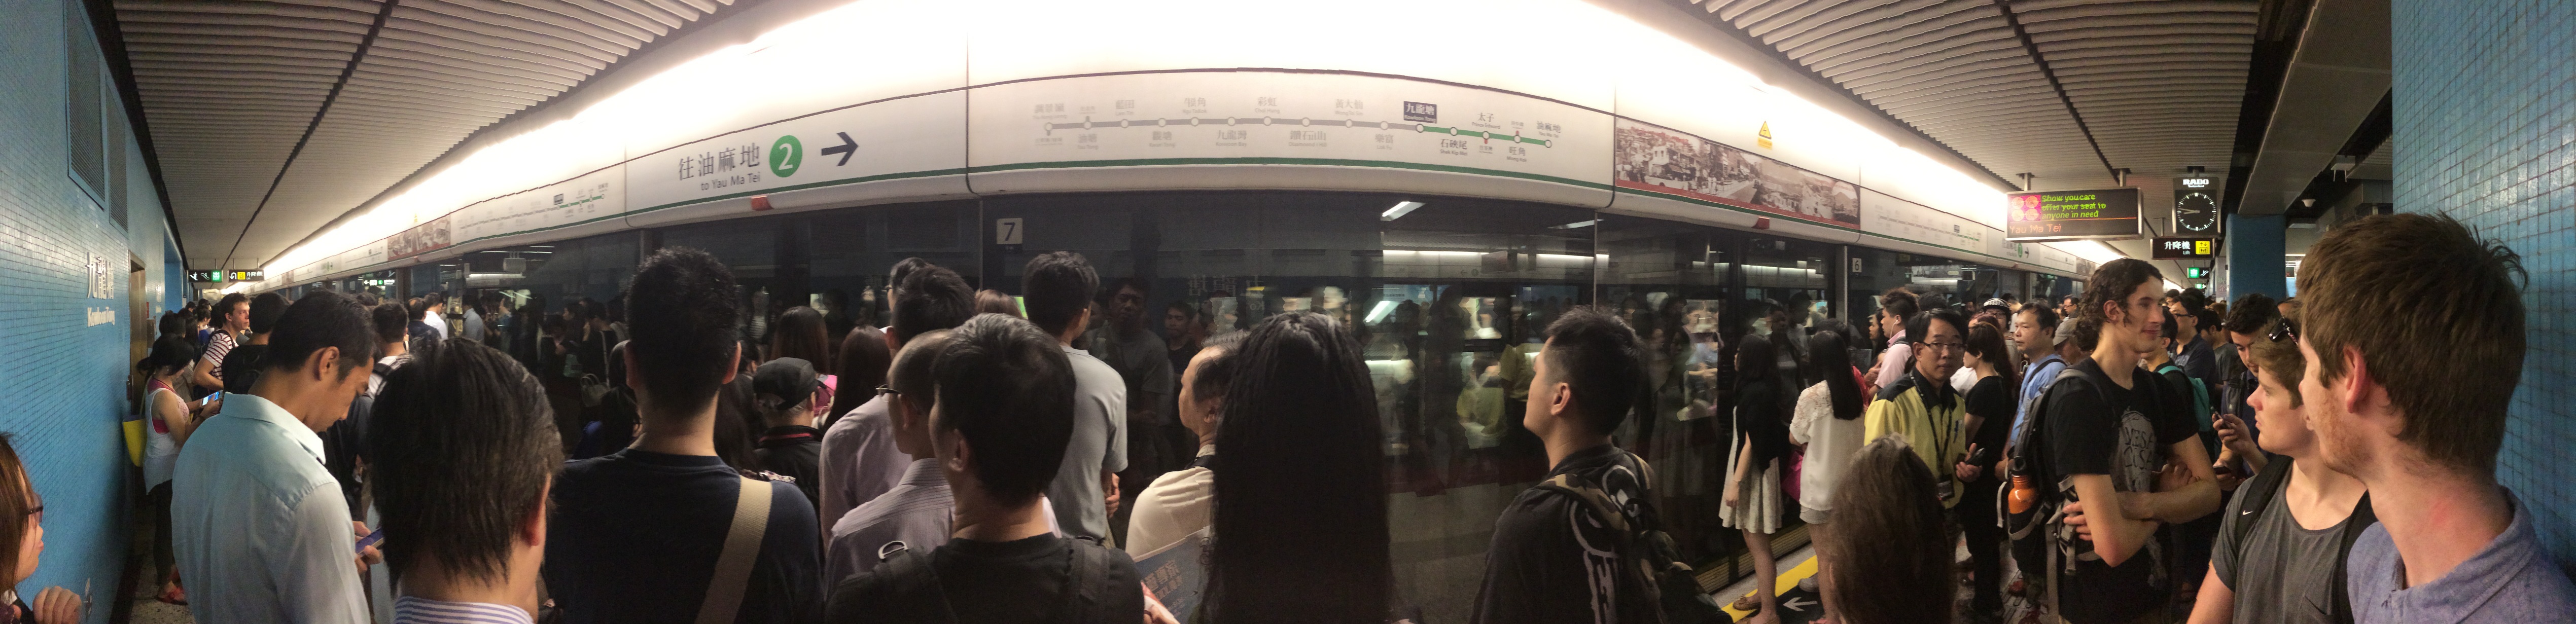
I’m slightly addicted to Panorama, yes, but wow, look at that station.
We went on the TurboJet to get a good ride across to Macau, sitting upstairs for sight-seeing and for a better ride. The students quickly got into the correct mode.

Why, yes, I would like to discuss that issue with you.

No pictures, please.
Landing in Macau itself, which is another country after all, we went through immigration and then outside the ferry terminal. where I had to constantly deflect the attentions of the touts who were all trying to get us onto a bus or a tour or something. One of the reasons to go to Macau was to show the students more of the region, the ecosystem of a casino-driven economy like Macau and the ways that cultures integrate differently, even with a similar group mixing in.
I wanted to start the students off at St Pauls, ruins in the heart of Macau island itself, so this required three cabs … and three languages. The first cab required me to dust off my terrible Mandarin (Qing day wo men qu da san ba pai fang?), the second pretended to understand my Sportuguese (Ruinas de Sao Paulo, por favor?), although it turned out that he tried to take the students for a ‘ride’ so they got out and walked the rest of the way, and the last one listened to my awful linguistics and said “St Paul’s” and away we went.
We (finally) all managed to meet up and, boy , was it hot! While being slightly less humid than Hong Kong, the Macau sun is a killer. I gave the team a potted history of Macau, pointed out some things, exhorted them to eat Macanese egg tarts (one of the finest desserts in the world) and then sent them off to explore, asking them to be back at the Ferry Terminal at 4:30 for a 5pm departure.

The group in front of St Paul’s.
The group split up into pairs and fours. Some went off to the Bungee Platform, and had a fantastic time I hear. Others drifted off to look at the glitz and glamour of Macau. All managed to get right into the movement, lane ways, food and egg tarts of a different culture, right on the doorstep of where they’d been living for the past three weeks.
I drifted off to remind myself of some of the more languid Macau experiences, having lunch at a nice Chinese place and taking pictures of the Macanese obsession with Neon. (Hong Kong and Macau take neon to new heights.)

This is a fairly restrained shopfront. You should see it at night!
I headed back to the ferry terminal early to get some work done (I am actually working on this trip so have to fit marking, planning and course coordination in amongst all of the intensive teaching and events). Come 4:30 we had most of the group back and I put them on to the ferry, while the last two screamed up in a taxi and we got on the boat just in time for a relaxing trip back to Hong Kong. (Pro tip: catching taxis in Macau is harder than it looks but your group leader will probably be understanding if the delay was caused by egg tarts.)
11 of us left for a fun side trip and all of us got back. I called that a success and left the group to make their own way back to the University while I made a side trip of my own up to the Ozone bar at the top of the Ritz-Carlton Hotel in West Kowloon. You can’t go to Hong Kong and not visit the highest bar in the world, now, can you?
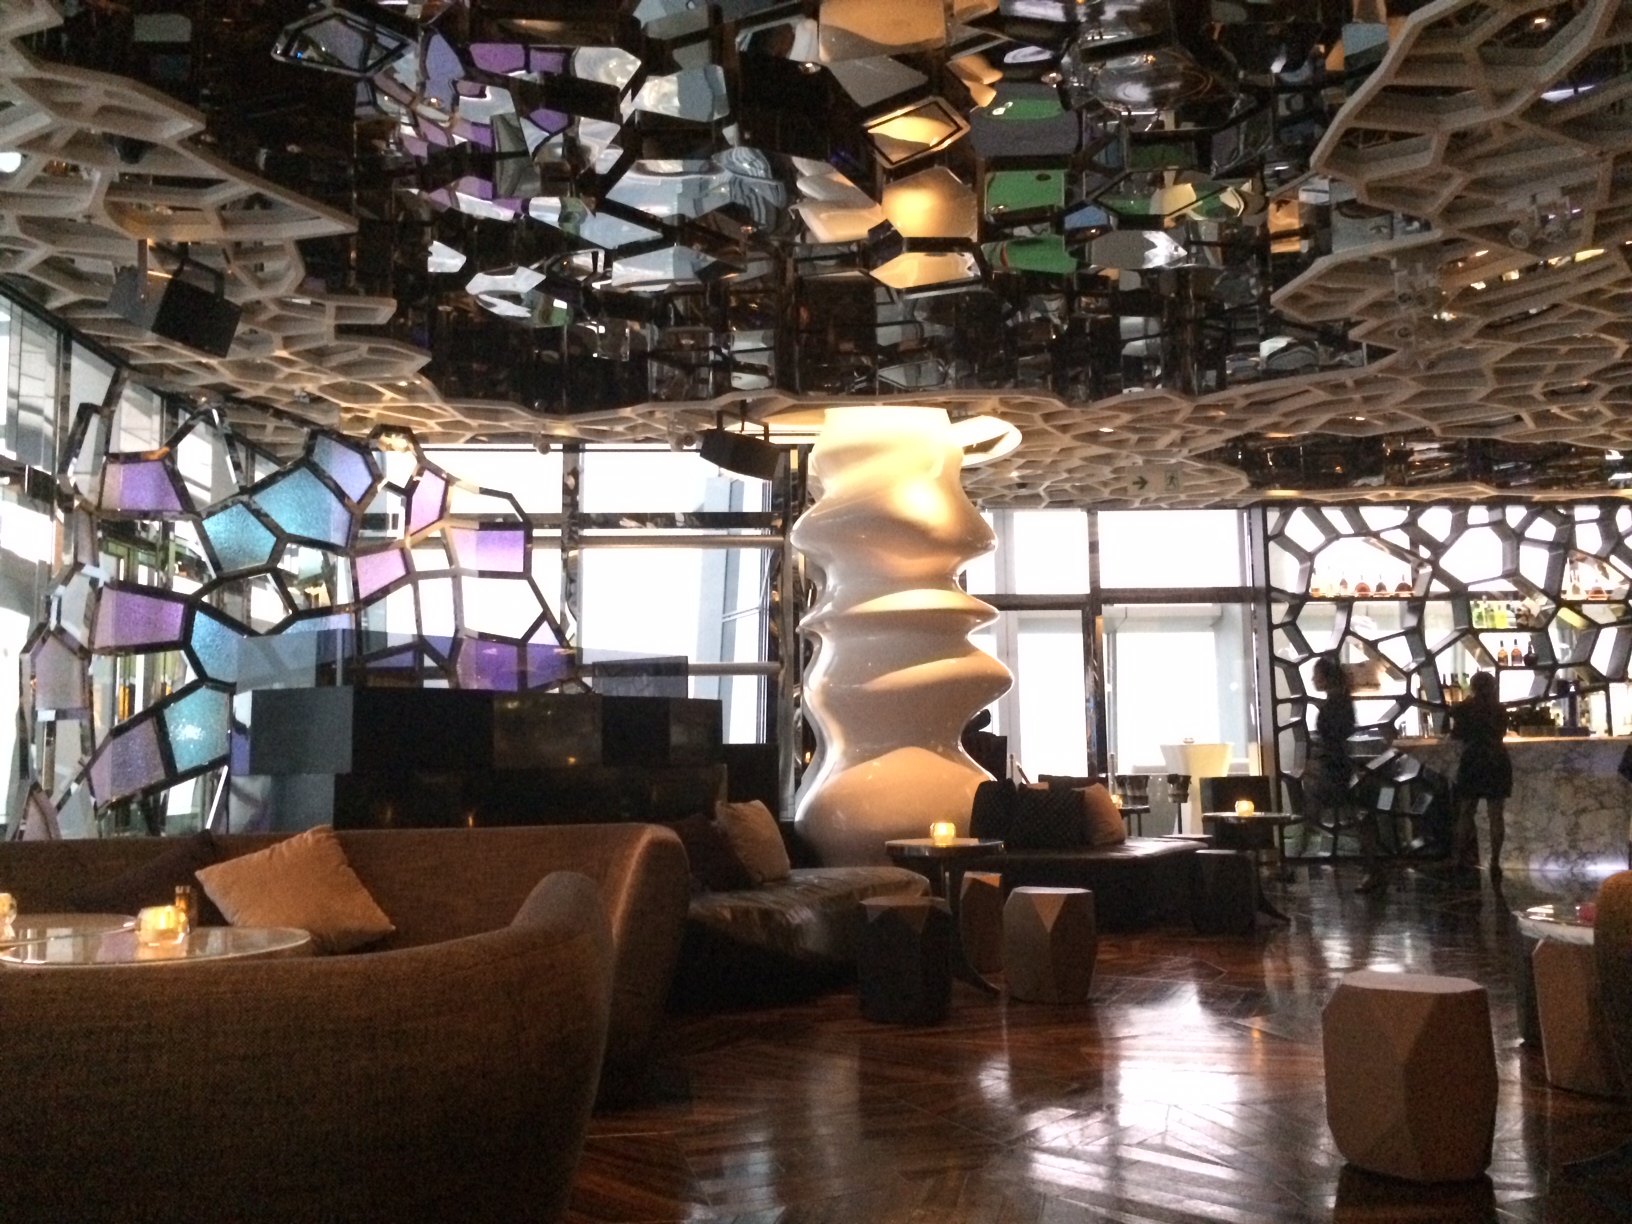
The Ozone bar’s design was ‘organically inspired’ but, fortunately, not in a Gigeresque manner.
Another great day, finished, and only two days left to go in the course!
Teaching in Hong Kong, Day 12
Posted: July 24, 2014 Filed under: Education | Tags: alumni, AsiaBound, Central, CUHK, CUHK campus, education, exams, exchange, higher education, Hong Kong, learning, Lee Woo Sing, Lee Woo Sing College, networking, podcasts, students, teaching, xkcd Leave a commentAfter another busy Monday, we had a discussion of all of the material that had featured in the podcasts and the podcasts themselves. It was quite obvious that the students had picked up the concepts involved and had a good working and application-level understanding of what was going on. (It turned out later that the students had in fact formed a study group for some of the podcast material, watching as a group for discussion. Nice to see that can happen without prompting!) This Tuesday was an important day because it was the last day of formal ‘coursework’ in the sense of new material being discussed in the course.
We covered network security, which is one of my many areas of interest, and went through all of the many ways that horrible things can happen to nice people. I had original wanted to extend this part of the course beyond the base course content but it had quickly become apparent that jamming more into this course wasn’t going to help anyone so I covered some of the material but not in as great a depth.
A vast amount of the stuff that we cover in security is actually really well summarised at XKCD, here’s an example:

XKCD 936 – It’s ok to stop using NVdisdf&Y3 as your password.
The end of the day was a briefing session, as we were off to Macau the next day for, well, getting a sense of the culture around here and seeing how another SAR functions in its new relationship with China. I also reminded the students that passports were required and, armed with excellent local knowledge from Louis Wong at the OAL, we prepared for a Macanese adventure.
Teaching in Hong Kong, Day 11
Posted: July 24, 2014 Filed under: Education | Tags: alumni, AsiaBound, Central, Cora Chan, CUHK, CUHK campus, education, exams, exchange, higher education, Hong Kong, learning, Lee Woo Sing, Lee Woo Sing College, networking, Radio-frequency Radiation Research Laboratory, students, teaching Leave a commentI think the third week crept up on us a bit. I asked my students about it later and they said that it had really started to fly – although everyone was feeling the pressure towards the end of week 2. On the Monday morning we met late to have the short exam and then I gave the students an hour for lunch before we headed off to tour the labs that are found around CUHK itself. Another OAL host, Cora Chan, picked us up from one of the many food outlets (it’s Hong Kong, food is very serious business here) and took us to visit the Virtual Reality, Visualisation and Imaging Centre, where our students got to see research and industrial application mixing together. We saw 3D imaging displays and a really interesting example of a training device to help medical professional develop their expertise at carrying out biopsies of tumours, using computerised measurement to give a quantified indication of accuracy. Usually, a human observes you to assess your technique. In this case, computerised measurement can tell you exactly where your probe went in relation to the ultrasound and the ‘tumour’ – actually a special sponge. Had you told me that my students would be carrying out biopsy practice on this trip, I wouldn’t have believed you. We’re all learning!

Dr Kelvin, your 3:00 is ready.
We then moved on to the Radio-frequency Radiation Research Laboratory, where the team look at interesting ways to send and receive communications-band radiation, while also carrying out formal assessment work of the possible effects on humans. To do this, they have one of the most amazing looking labs in the world…
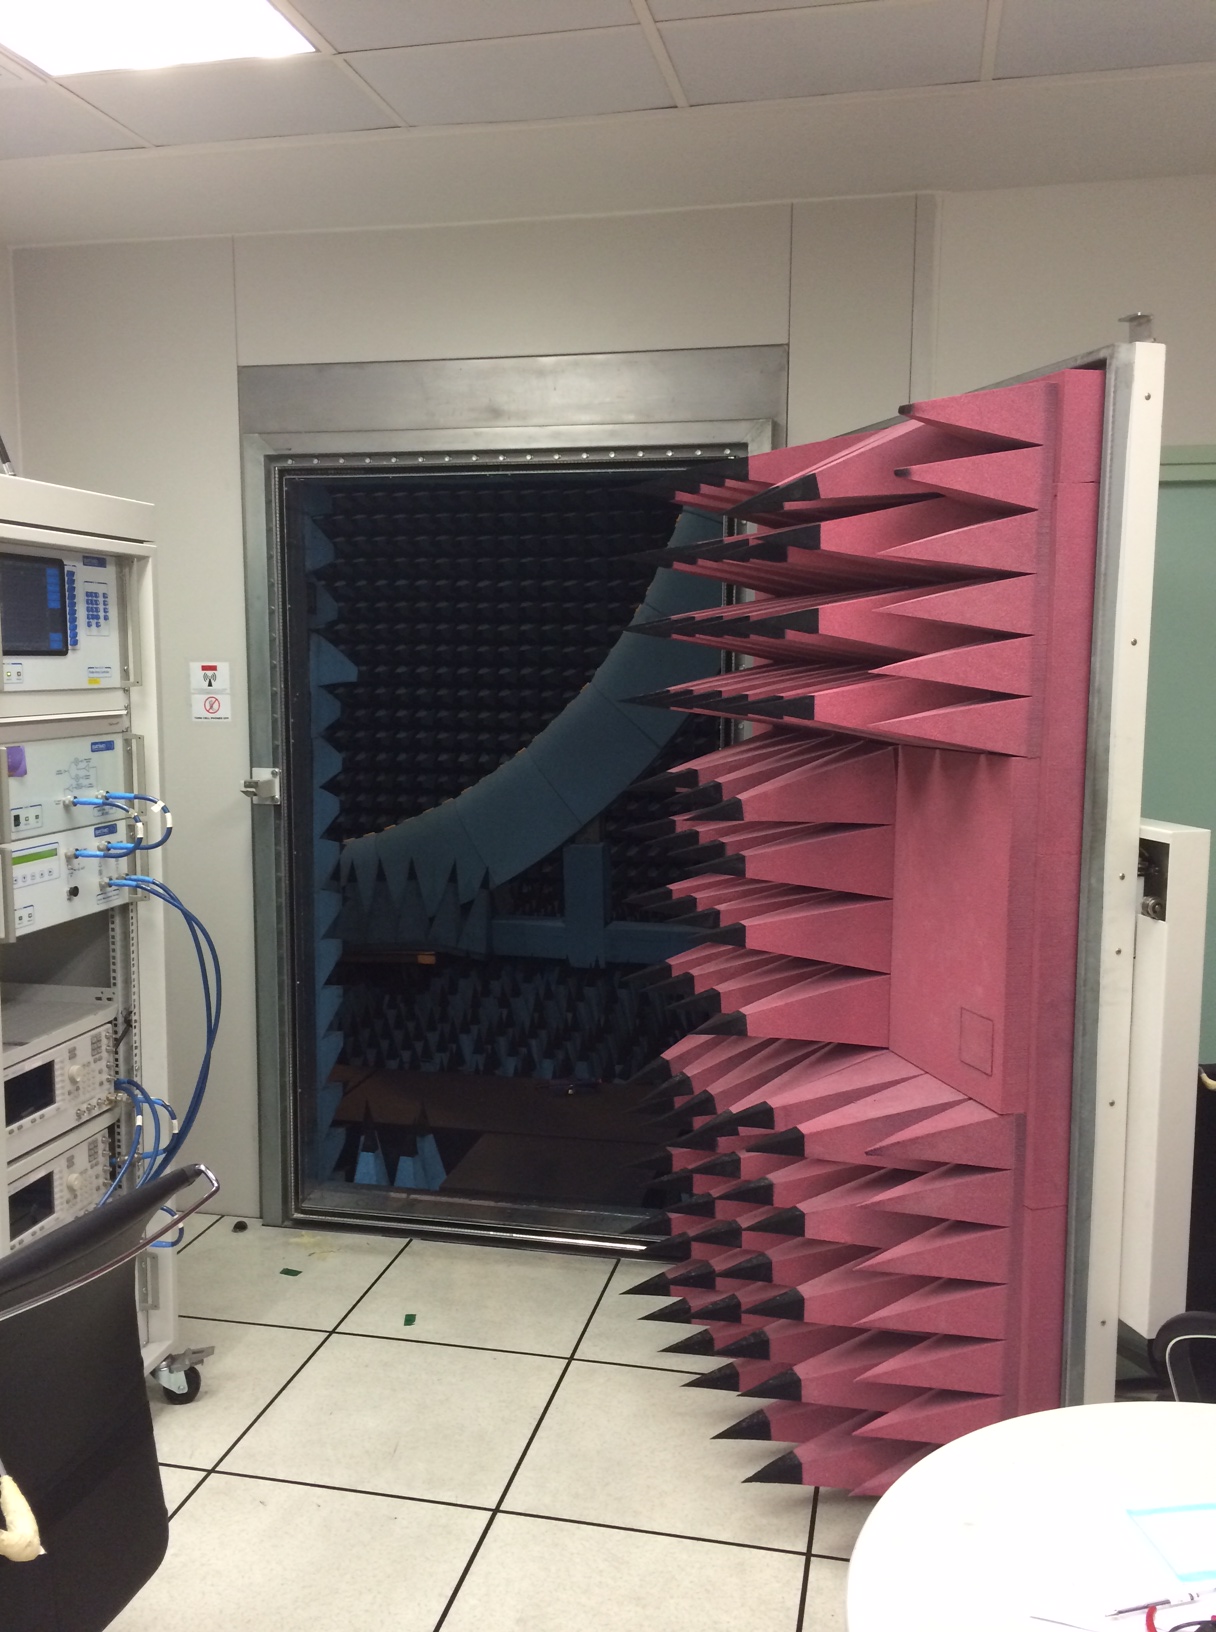
Come into the lab…
Thats the door to an anechoic chamber, designed to completely isolate anyone inside from outside electromagnetic radiation – and it’s also eerily silent because it absorbs all noise. Of course, all of us had to step inside – it’s 7m tall, which makes it one of the biggest labs of this type that there is.
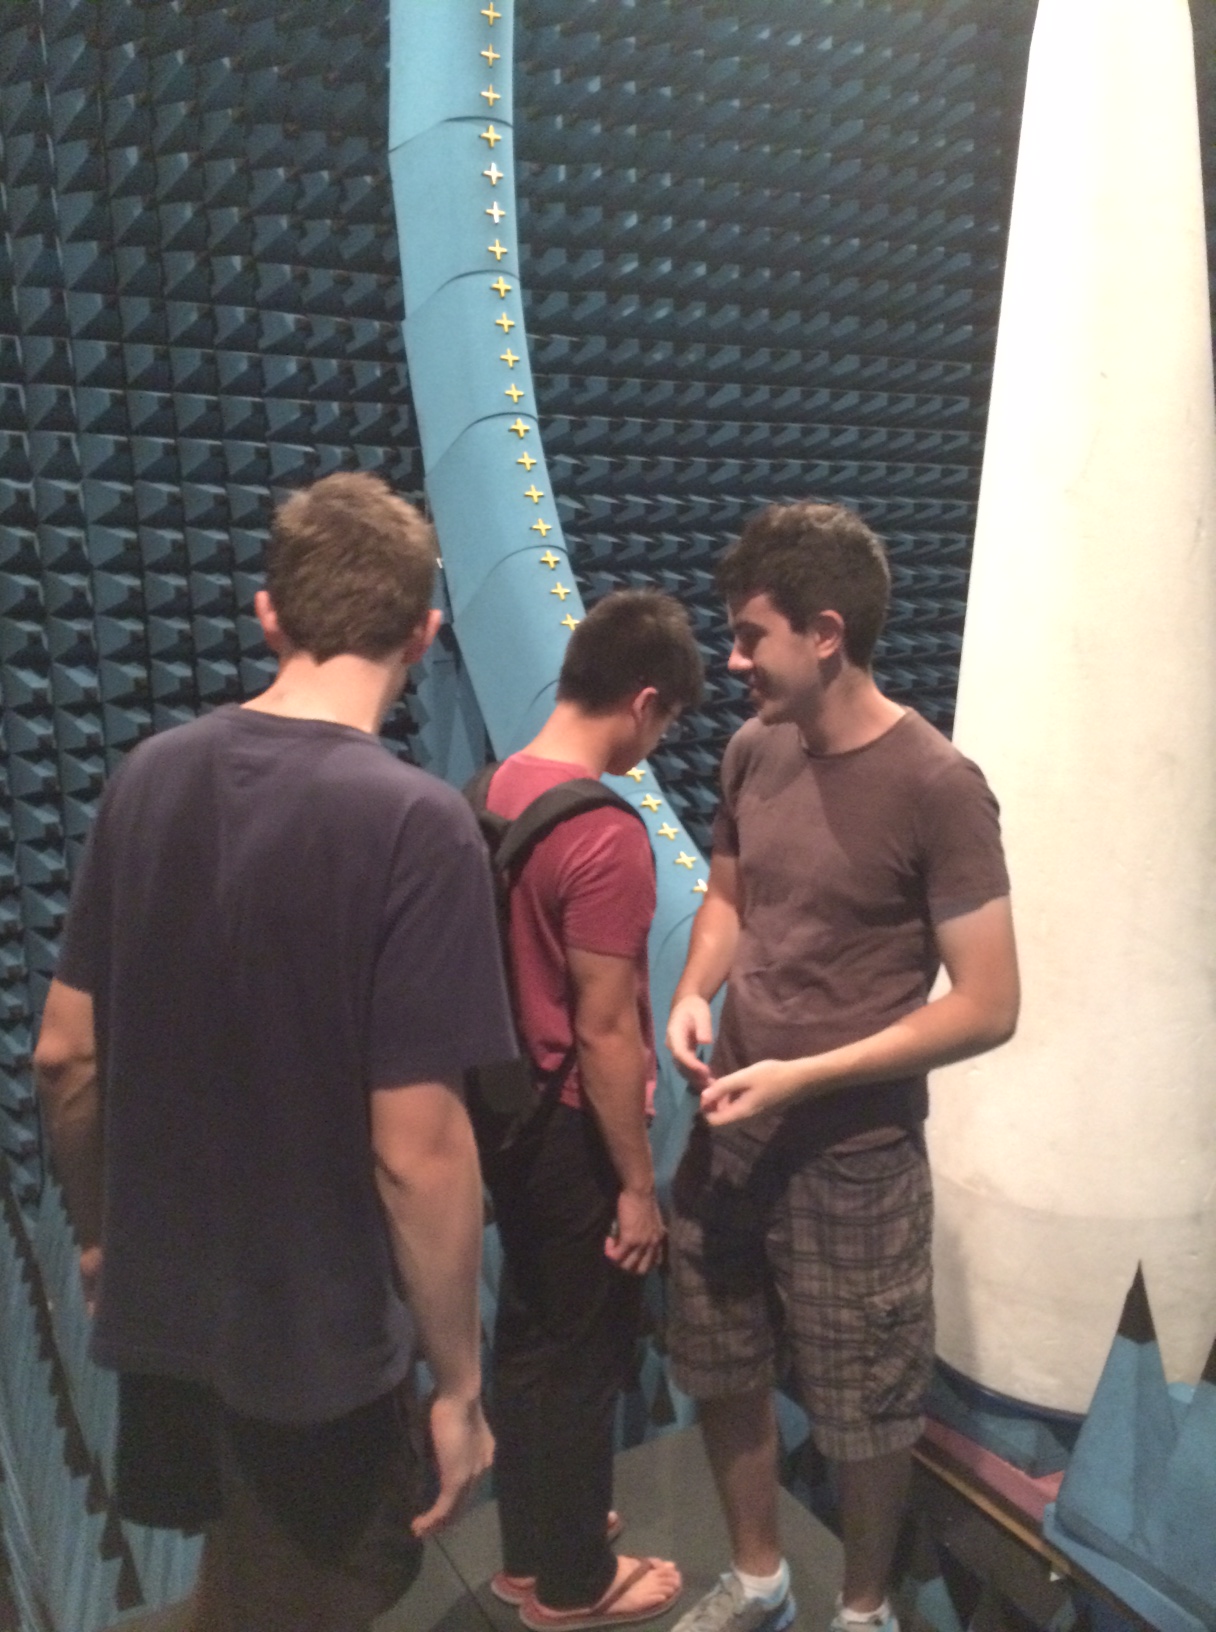
That’s not actually a Star Gate in the background.
It is eerily quiet in there and that giant ring, studded with sensors, is the detector array. Here’s a vertical panorama that tries to capture what the whole chamber looks like. I have included an ISO Standard Tullie for scale.

It really is massive.
With this apparatus, and a range of things including human substitutes and replay-able mobile emissions, the team can check that an antenna is putting where it should be and not cooking anyone. Always good! The last lab on the tour was the Networked Sensors and Robotics Laboratory, where we started the tour by looking at robots designed to assist in surgery. In the picture below, the small robot to the front takes the role of a human and stabilises the patient’s internal organs for a 90-120 minute operation, where a human would typically tire. This is classic assistive robotics – they do something that we potentially have neither the strength nor patience to be able to achieve with high reliability.

Robots!
In the background, yo0u can see a device that helps a surgeon stabilise the tools required for keyhole surgery – an assistant who never shakes and never tires, no matter how long it goes on. Right now these all have to be manually positioned, which still needs human involvement, but the team go to their cadaver trials very shortly and would hope to have devices like the organ assistant robot deployed into surgical theatres by 2015-2016. Good thing to keep in mind when you’re visiting hospital! We then went to see some more work being done by the students in the group on robot autonomy and position determination – taking robots to the point where, instead of careering around the room like a deranged Roomba, they learn paths properly and can follow them, on land and or on water, but without ground assisted guidance. Overall, a fantastic day for seeing research in action and, as one of the students noted, he now knew more about research at CUHK than he did about what we did back home. Hmm. Good point, we’re going to have to fix that! Thanks again to Cora and all the teams who helped us out today.
